 |
FT71 Colors (@ES#) cpayne [totalcount]
7 years 10 months ago
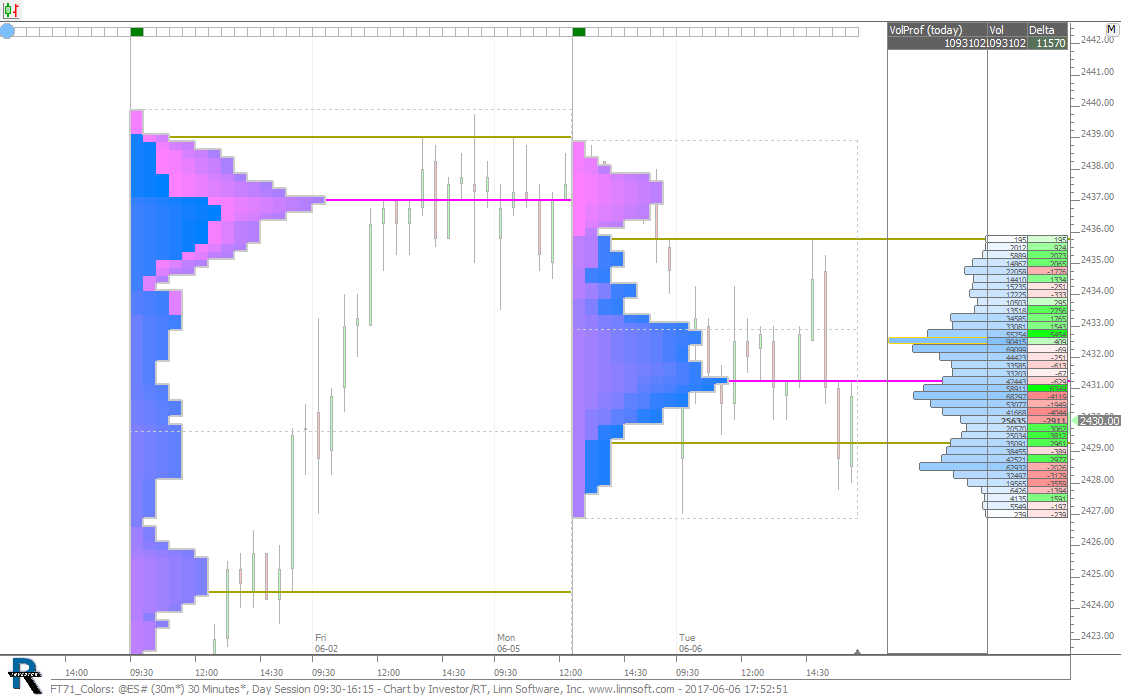
Colors chart used in FuturesTrader71 Webinar on June 6, 2017. This chart was uploaded by Investor/RT 12.7.5 showing symbol: @ES#. |
View |
 |
FT71 Boundaries (@ES#) cpayne [totalcount]
7 years 10 months ago
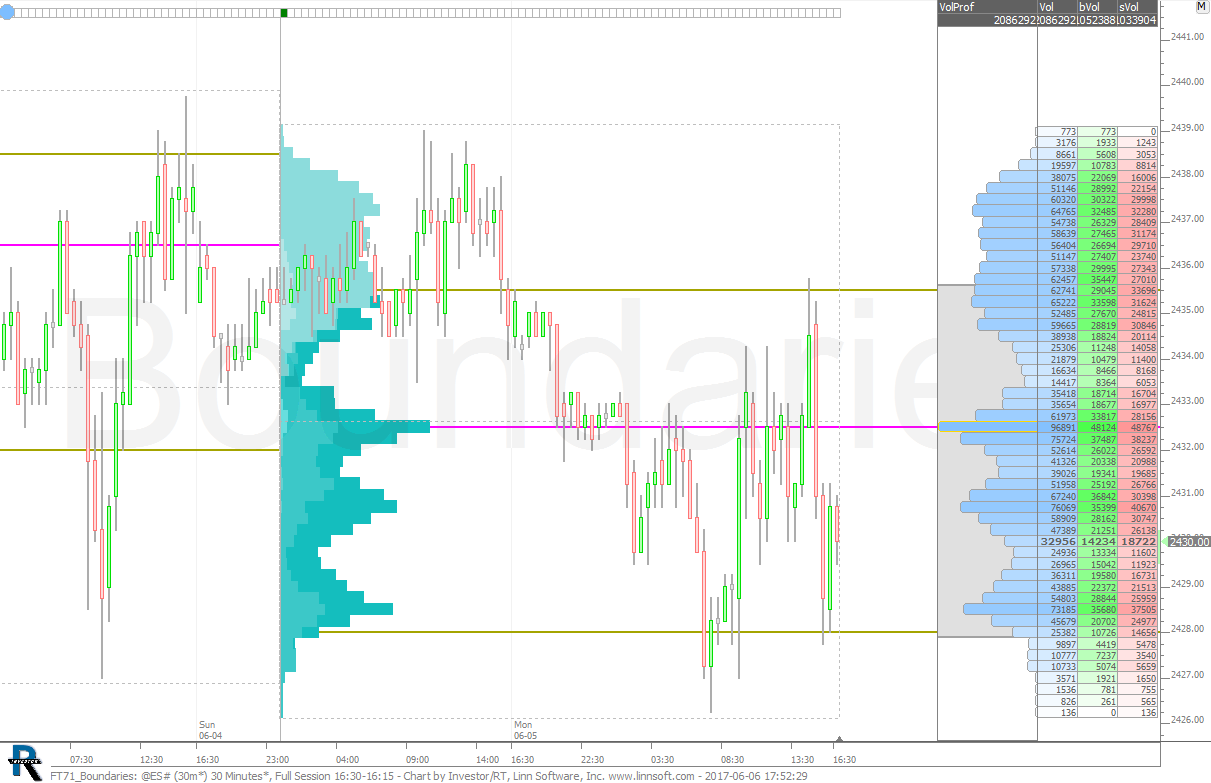
Boundaries chart used in FuturesTrader71 Webinar on June 6, 2017. This chart was uploaded by Investor/RT 12.7.5 showing symbol: @ES#. |
View |
 |
FT71 PaintIndicators (@ES#) cpayne [totalcount]
7 years 10 months ago
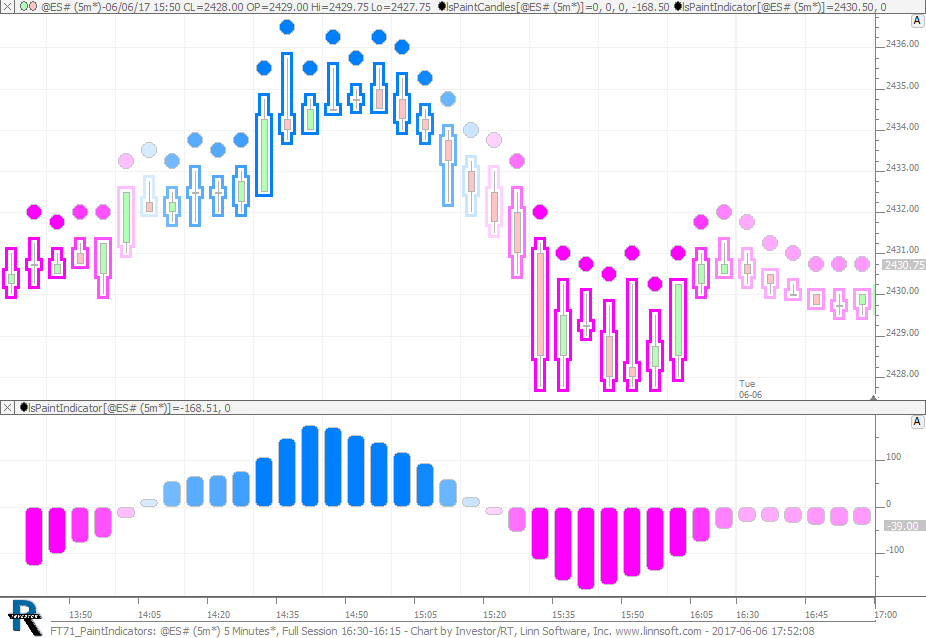
PaintCandle and PaintIndicator chart used in FuturesTrader71 Webinar on June 6, 2017. This chart was uploaded by Investor/RT 12.7.5 showing symbol: @ES#. |
View |
 |
FT71 Clock (@ES#) cpayne [totalcount]
7 years 10 months ago
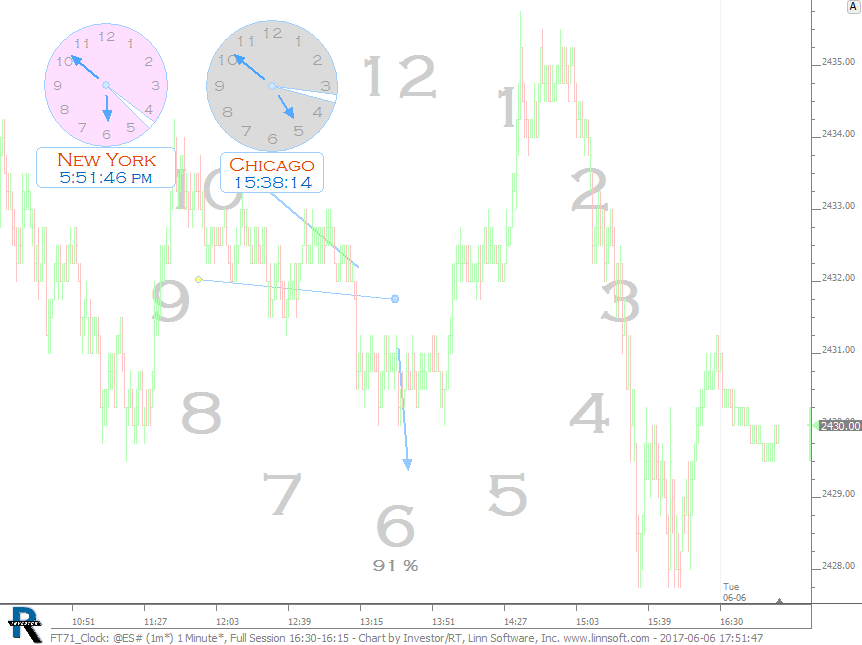
Clock chart used in FuturesTrader71 Webinar on June 6, 2017. This chart was uploaded by Investor/RT 12.7.5 showing symbol: @ES#. |
View |
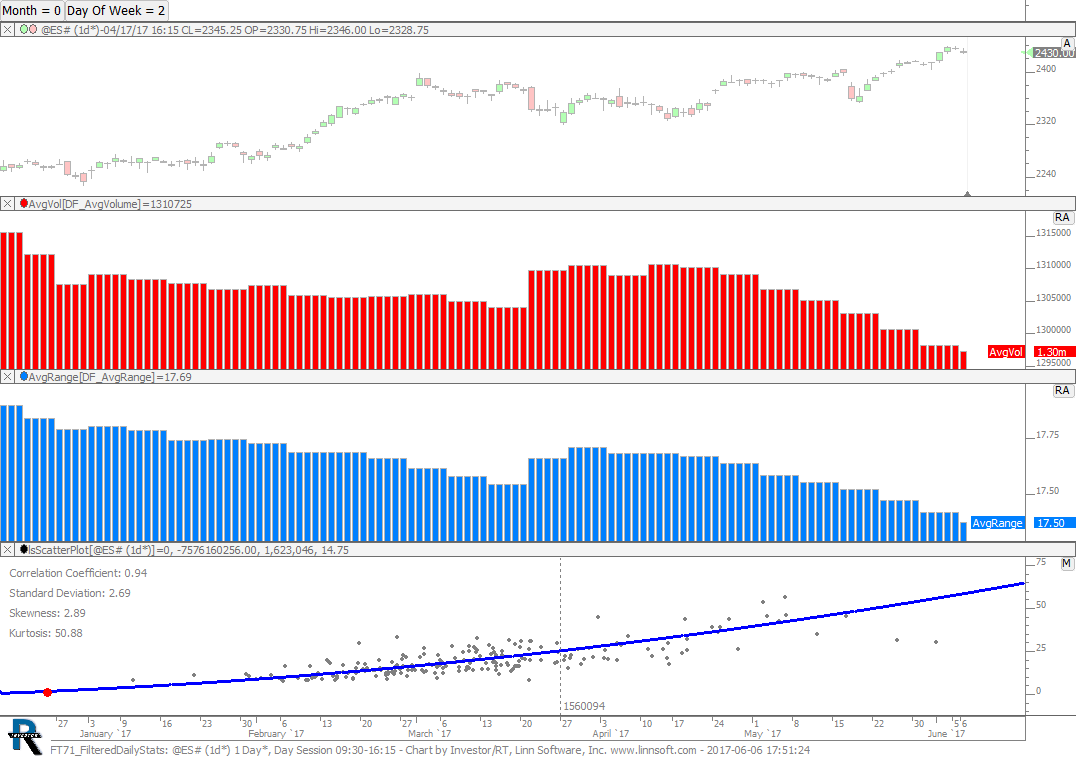 |
FT71 FilteredDailyStats (@ES#) cpayne [totalcount]
7 years 10 months ago
Filtered Data Statistics chart used in FuturesTrader71 Webinar on June 6, 2017. This chart was uploaded by Investor/RT 12.7.5 showing symbol: @ES#. |
View |
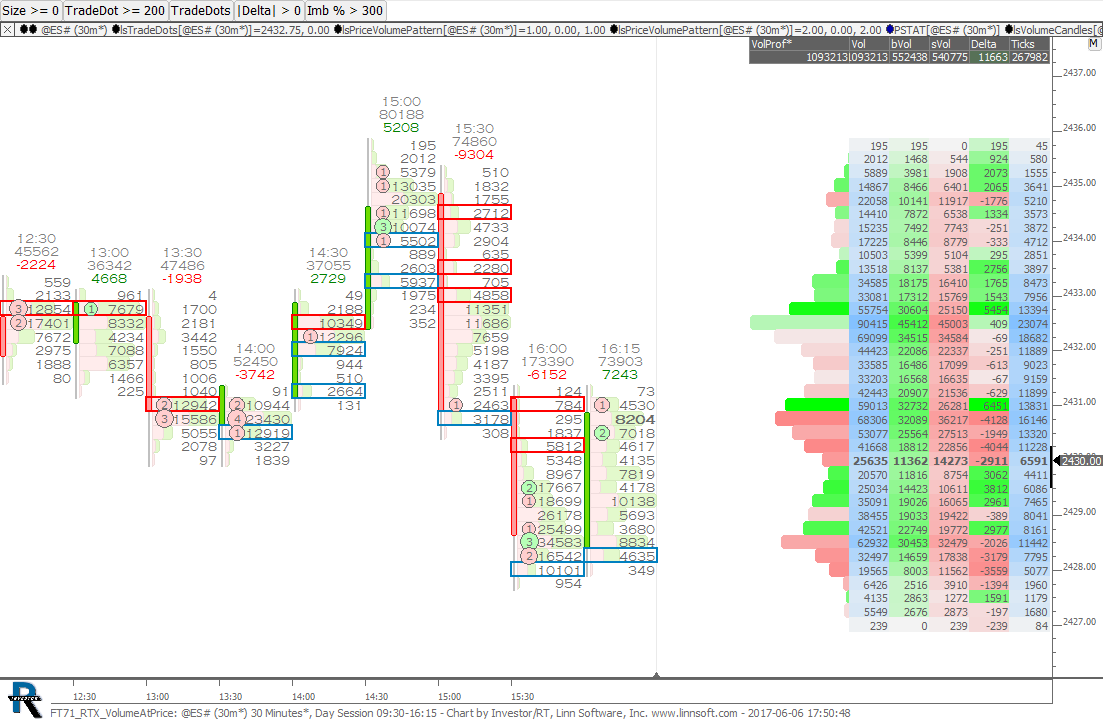 |
FT71 RTX VolumeAtPrice (@ES#) cpayne [totalcount]
7 years 10 months ago
VolumeAtPrice chart used in FuturesTrader71 Webinar on June 6, 2017. This chart was uploaded by Investor/RT 12.7.5 showing symbol: @ES#. |
View |
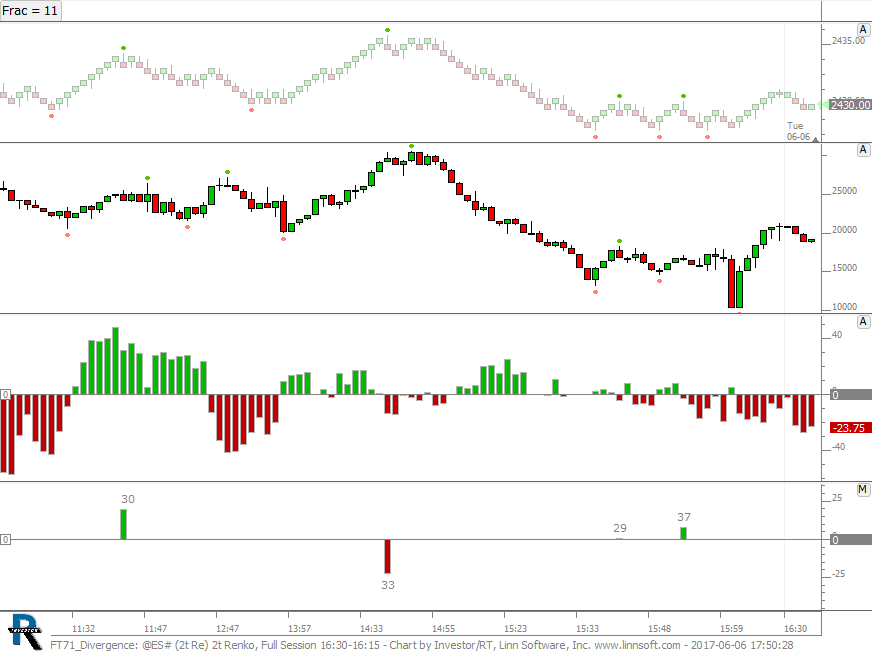 |
FT71 Divergence (@ES#) cpayne [totalcount]
7 years 10 months ago
Divergence chart used in FuturesTrader71 Webinar on June 6, 2017. This chart was uploaded by Investor/RT 12.7.5 showing symbol: @ES#. |
View |
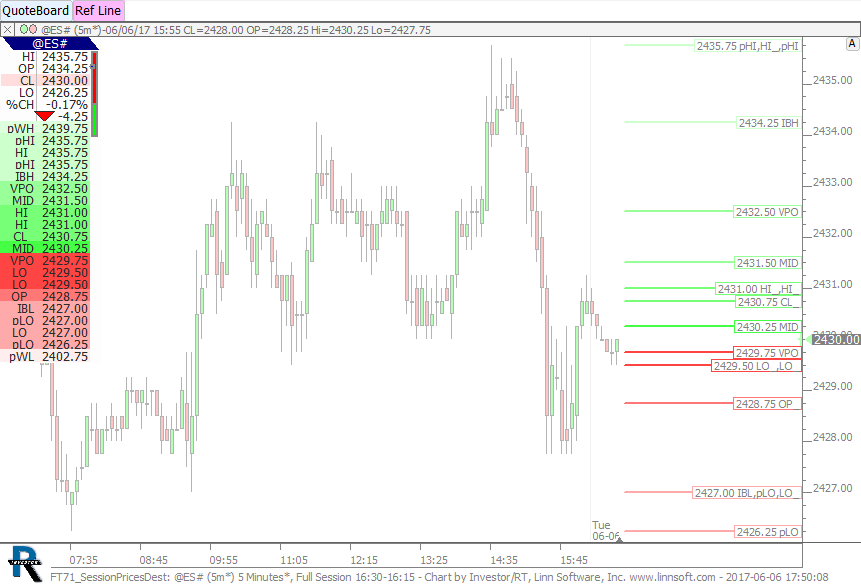 |
FT71 SessionPricesDest (@ES#) cpayne [totalcount]
7 years 10 months ago
SessionPrices Destination chart used in FuturesTrader71 Webinar on June 6, 2017. This chart was uploaded by Investor/RT 12.7.5 showing symbol: @ES#. |
View |
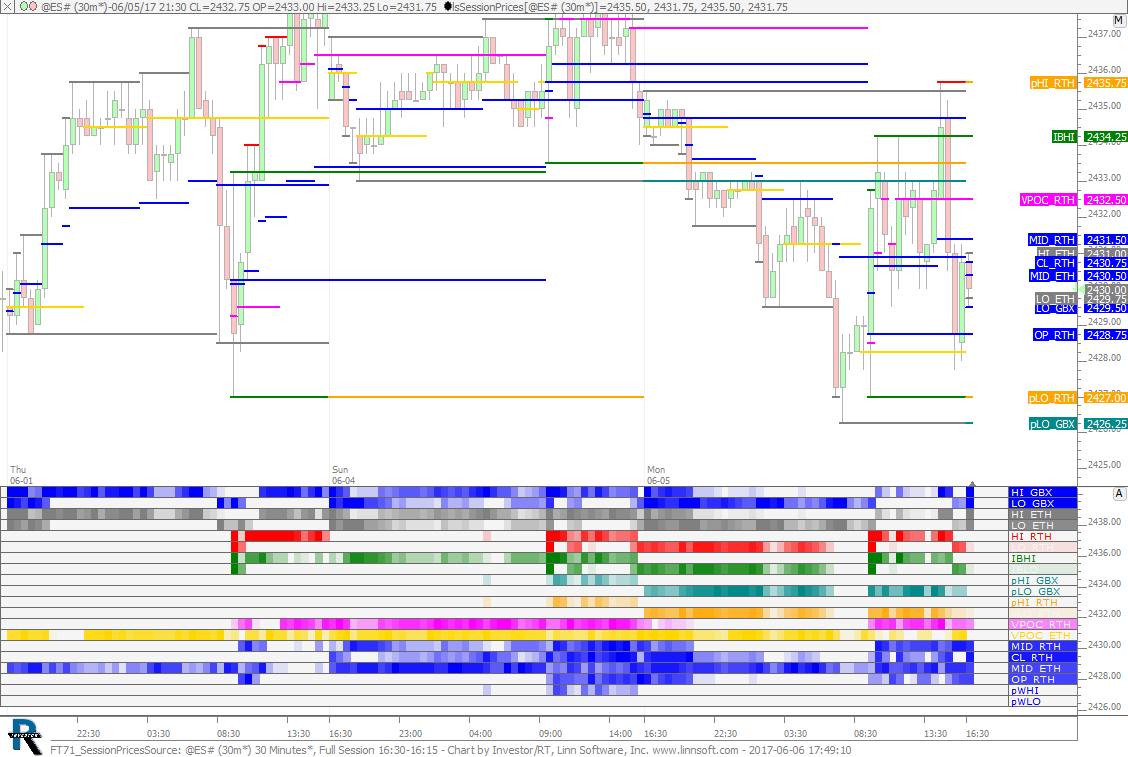 |
FT71 SessionPricesSource (@ES#) cpayne [totalcount]
7 years 10 months ago
SessionPrices chart used in FuturesTrader71 Webinar on June 6, 2017. This chart was uploaded by Investor/RT 12.7.5 showing symbol: @ES#. |
View |
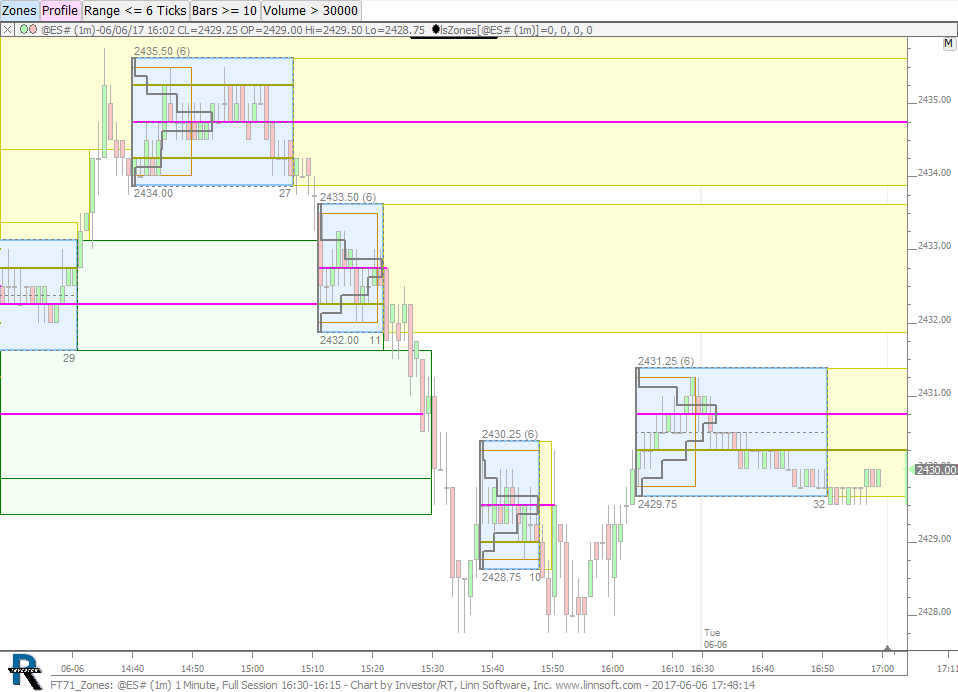 |
FT71 Zones (@ES#) cpayne [totalcount]
7 years 10 months ago
Zones chart used in FuturesTrader71 Webinar on June 6, 2017. This chart was uploaded by Investor/RT 12.7.5 showing symbol: @ES#. |
View |
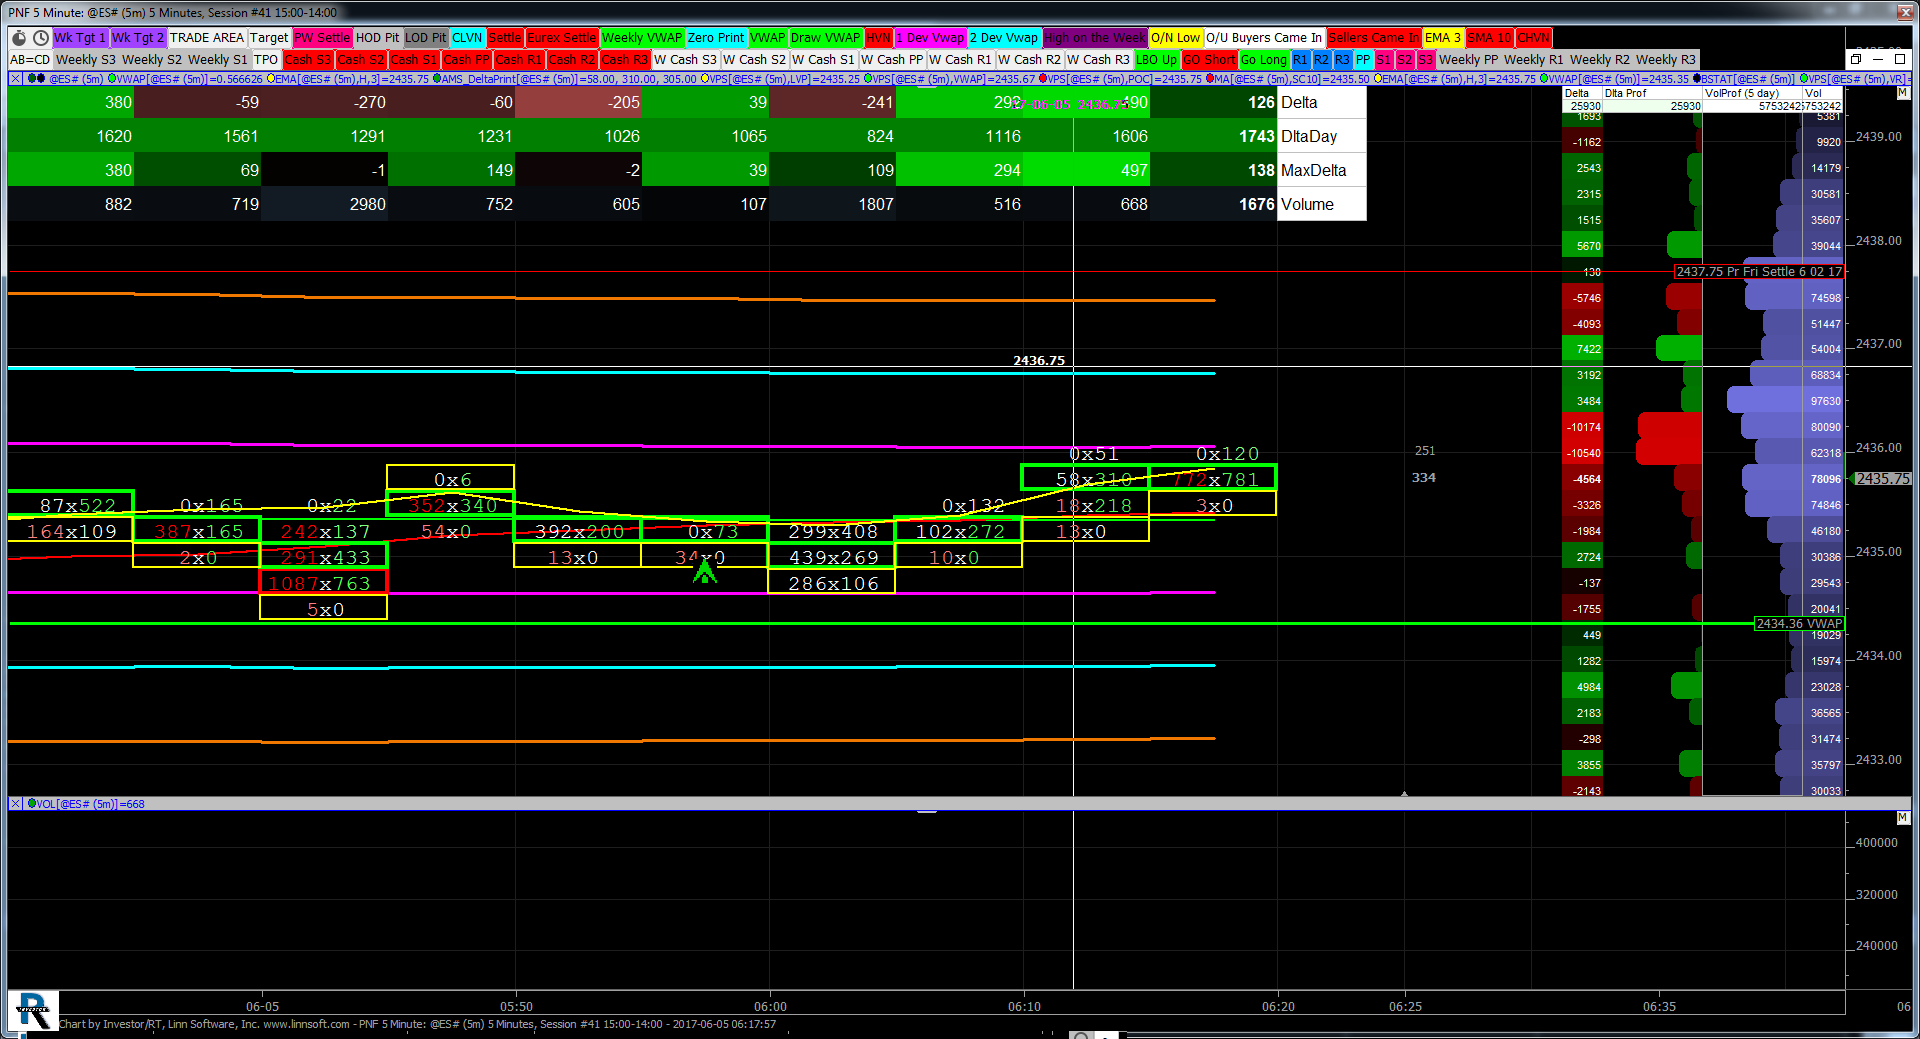 |
PNF 5 Minute (@ES#) Marvin Baker [totalcount]
7 years 10 months ago
This chart was uploaded by Investor/RT 12.7.4 showing symbol: @ES#. |
View |
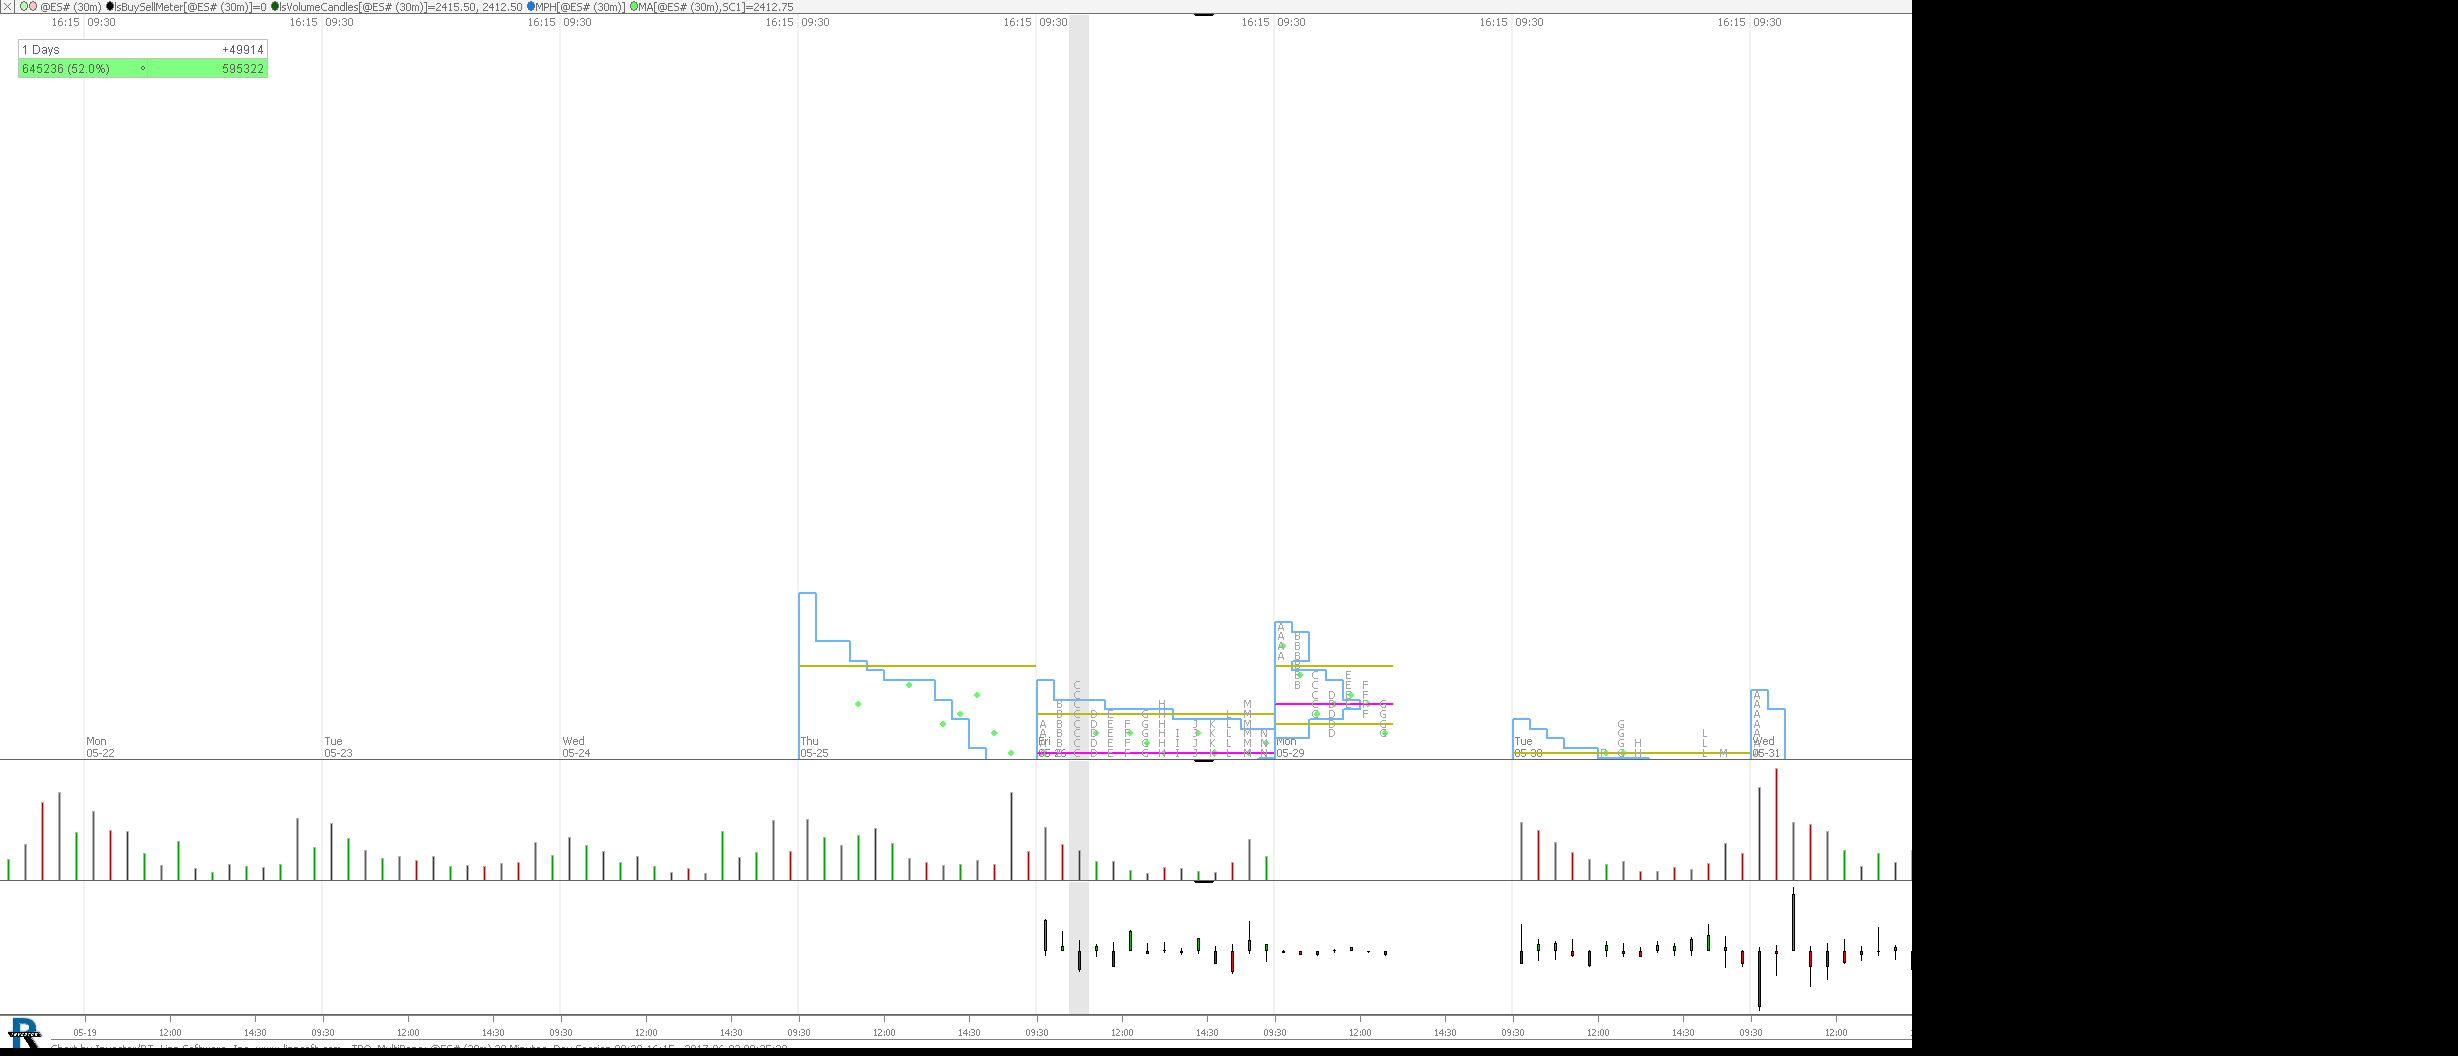 |
TPO MultiPane (@ES#) Mike Banks [totalcount]
7 years 10 months ago
Alan, look at trhis clever TPO multi-pane chart with Volumedelta and volume candles. This chart was uploaded by Investor/RT 12.7.4 showing symbol: @ES#. |
View |
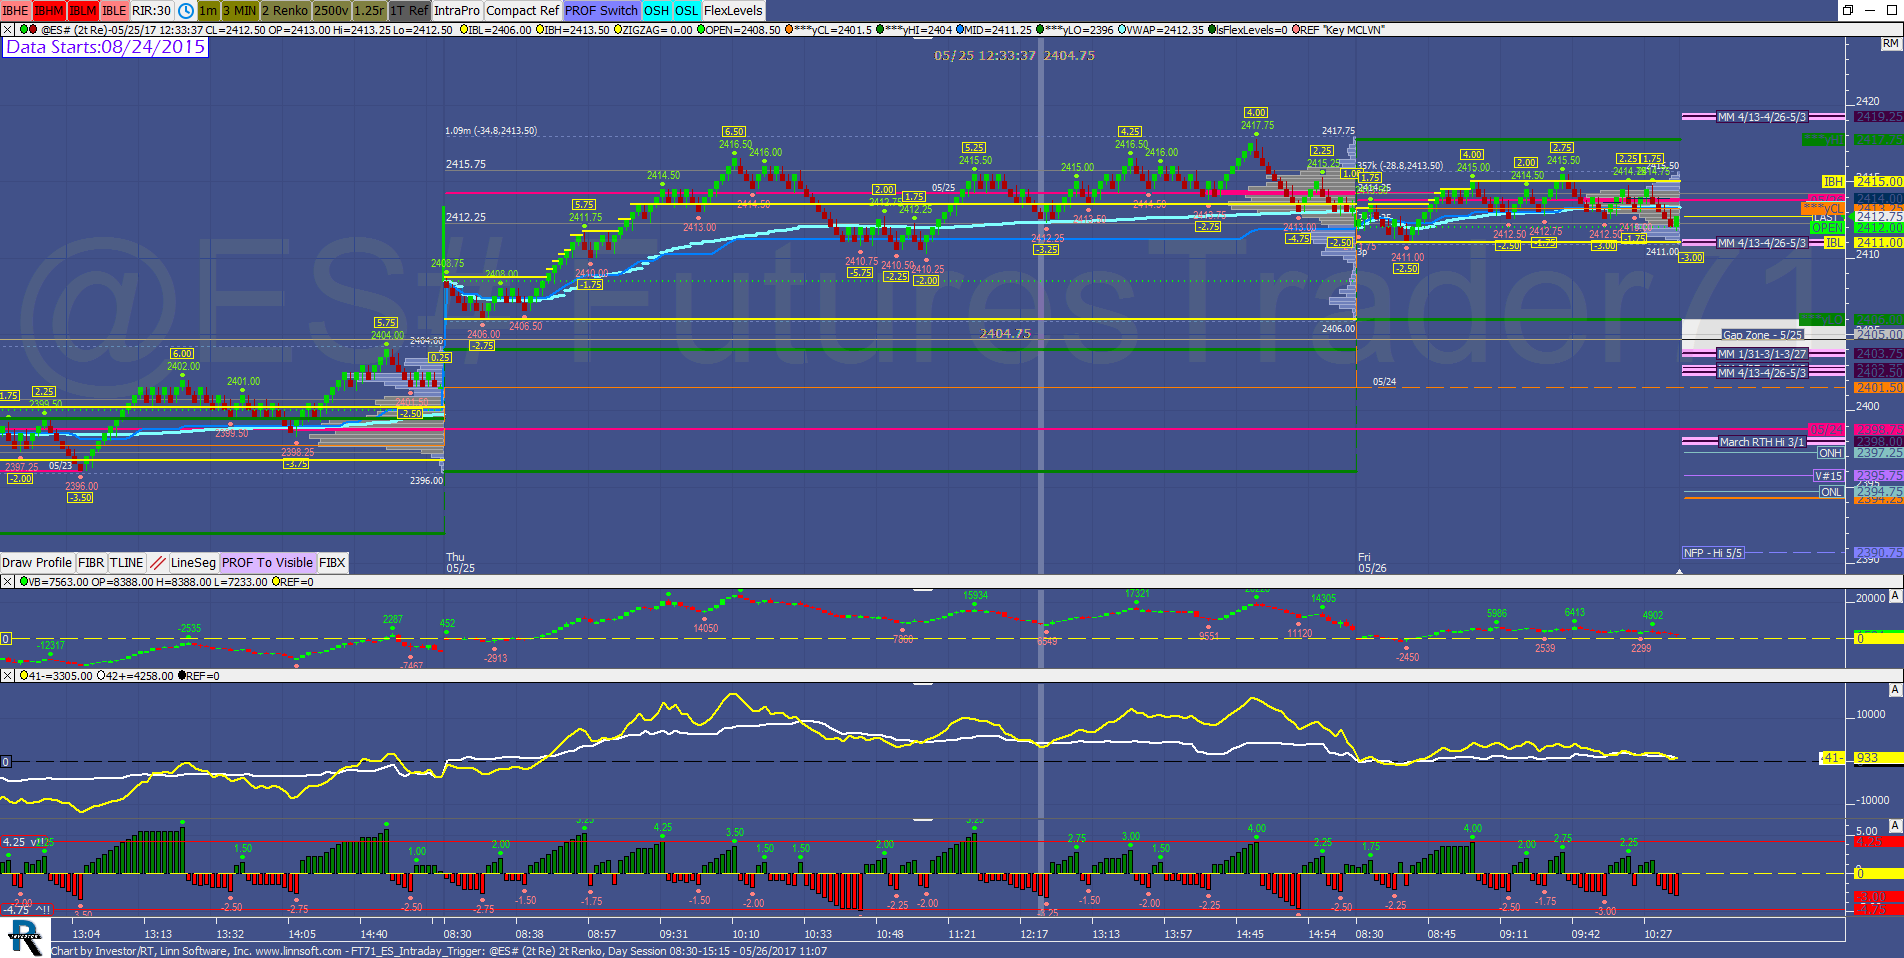 |
FT71 ES Intraday Trigger (@ES#) oyvegh [totalcount]
7 years 11 months ago
I am unable to get ONH and ONL to show on this copy of defintion from FT. Also, not able to see the rotation pane. I have deleted the ES chart and copied definition into IRT with same results.... |
View |
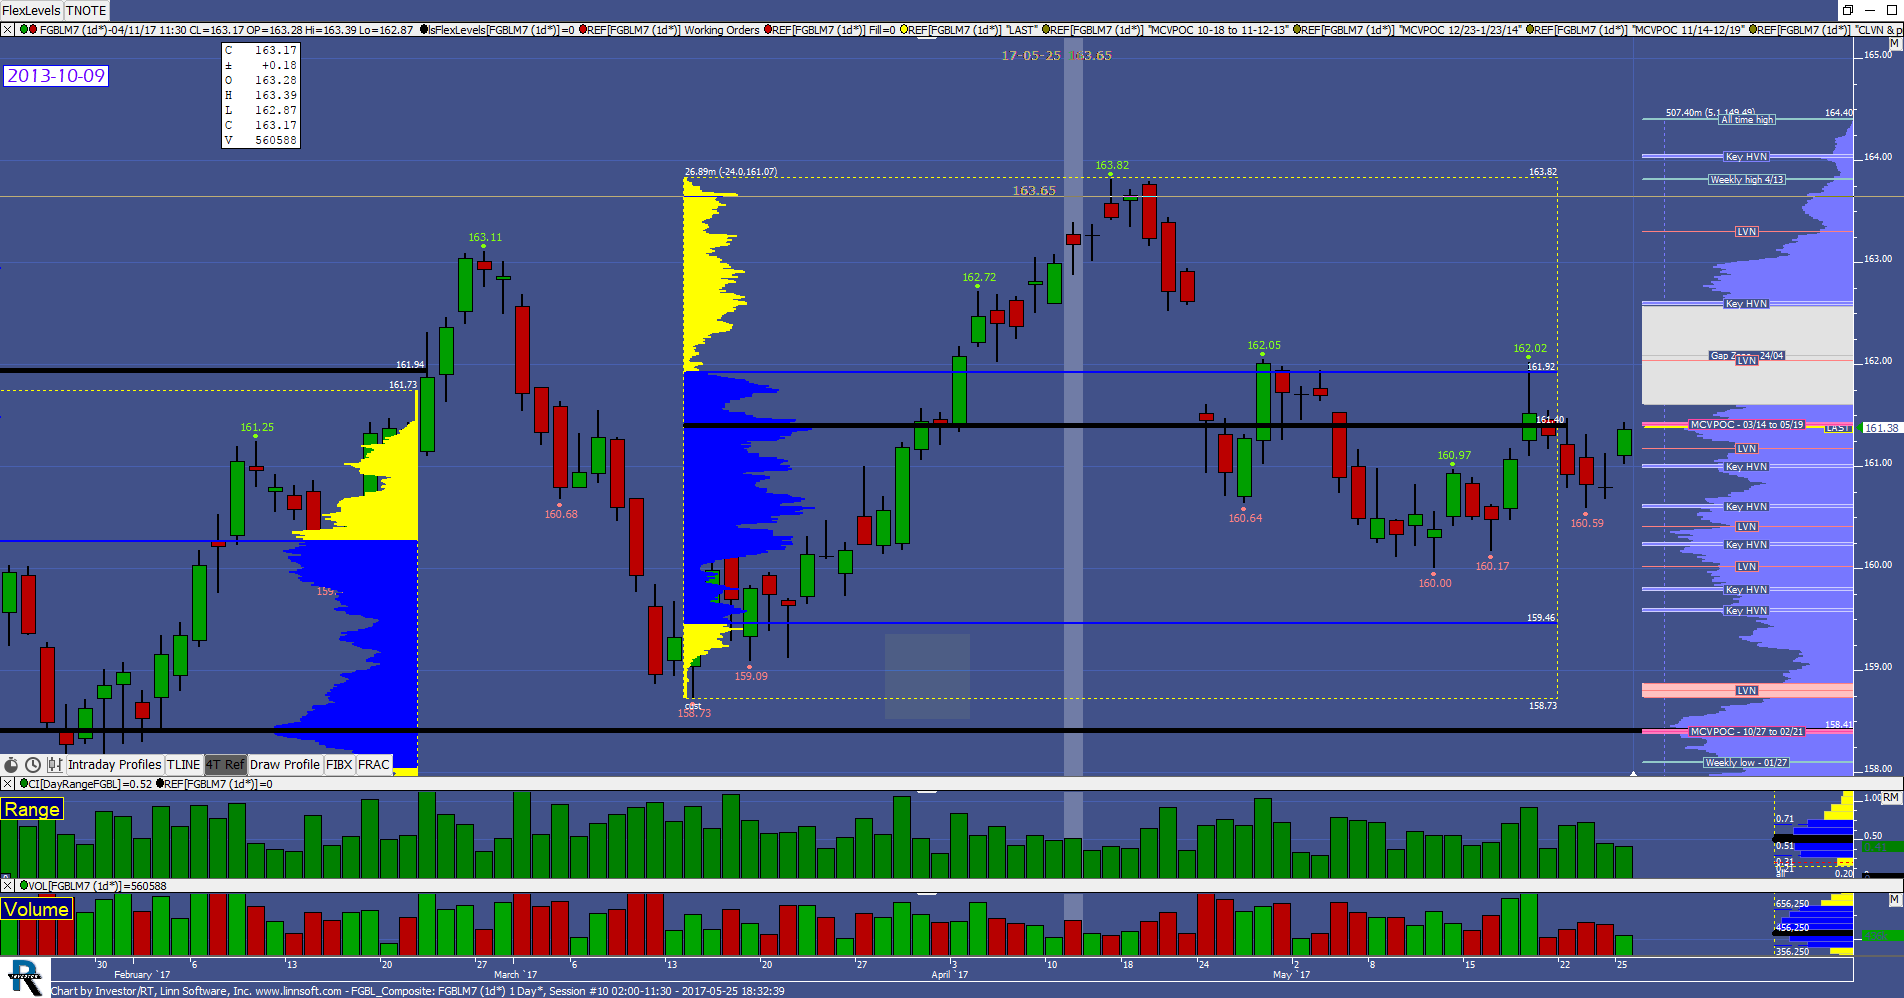 |
FGBL Composite (FGBLM7) Food4Monkeys [totalcount]
7 years 11 months ago
FGBL Week start. This chart was uploaded by Investor/RT 12.7.3 showing symbol: FGBLM7. |
View |
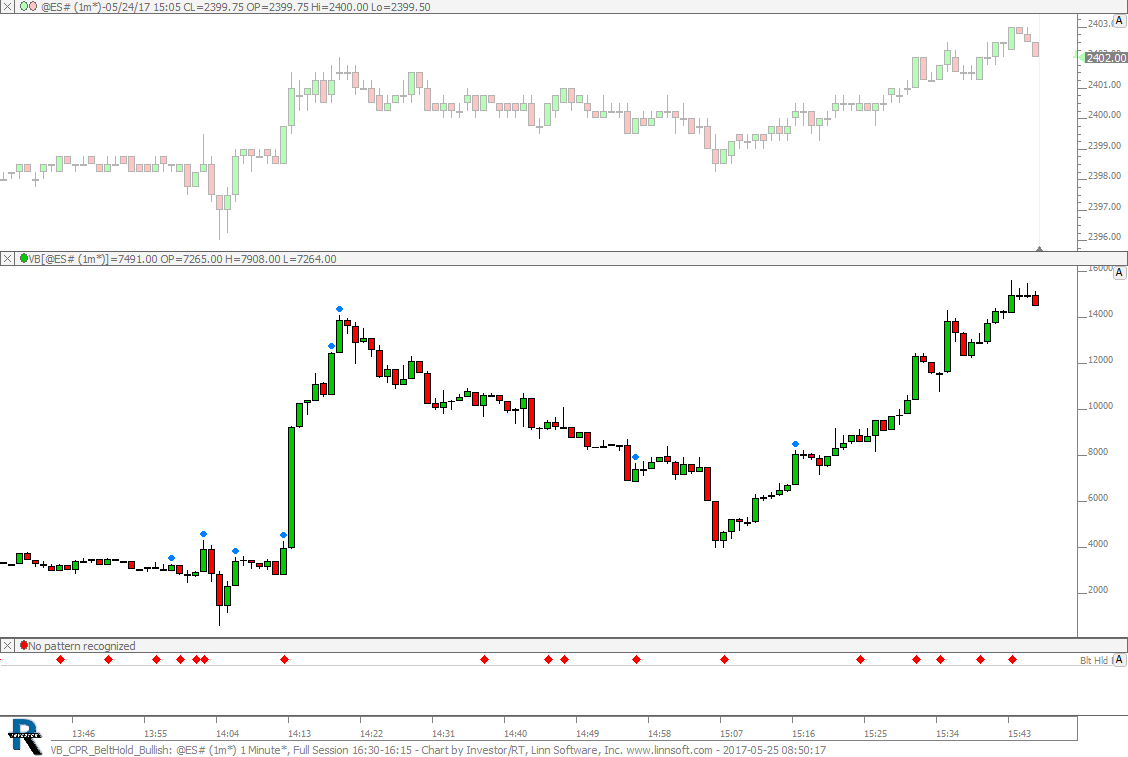 |
VB CPR BeltHold Bullish (@ES#) cpayne [totalcount]
7 years 11 months ago
Candlestick Pattern Recognition on Volume Breakdown. This chart was uploaded by Investor/RT 12.7.3 showing symbol: @ES#. |
View |
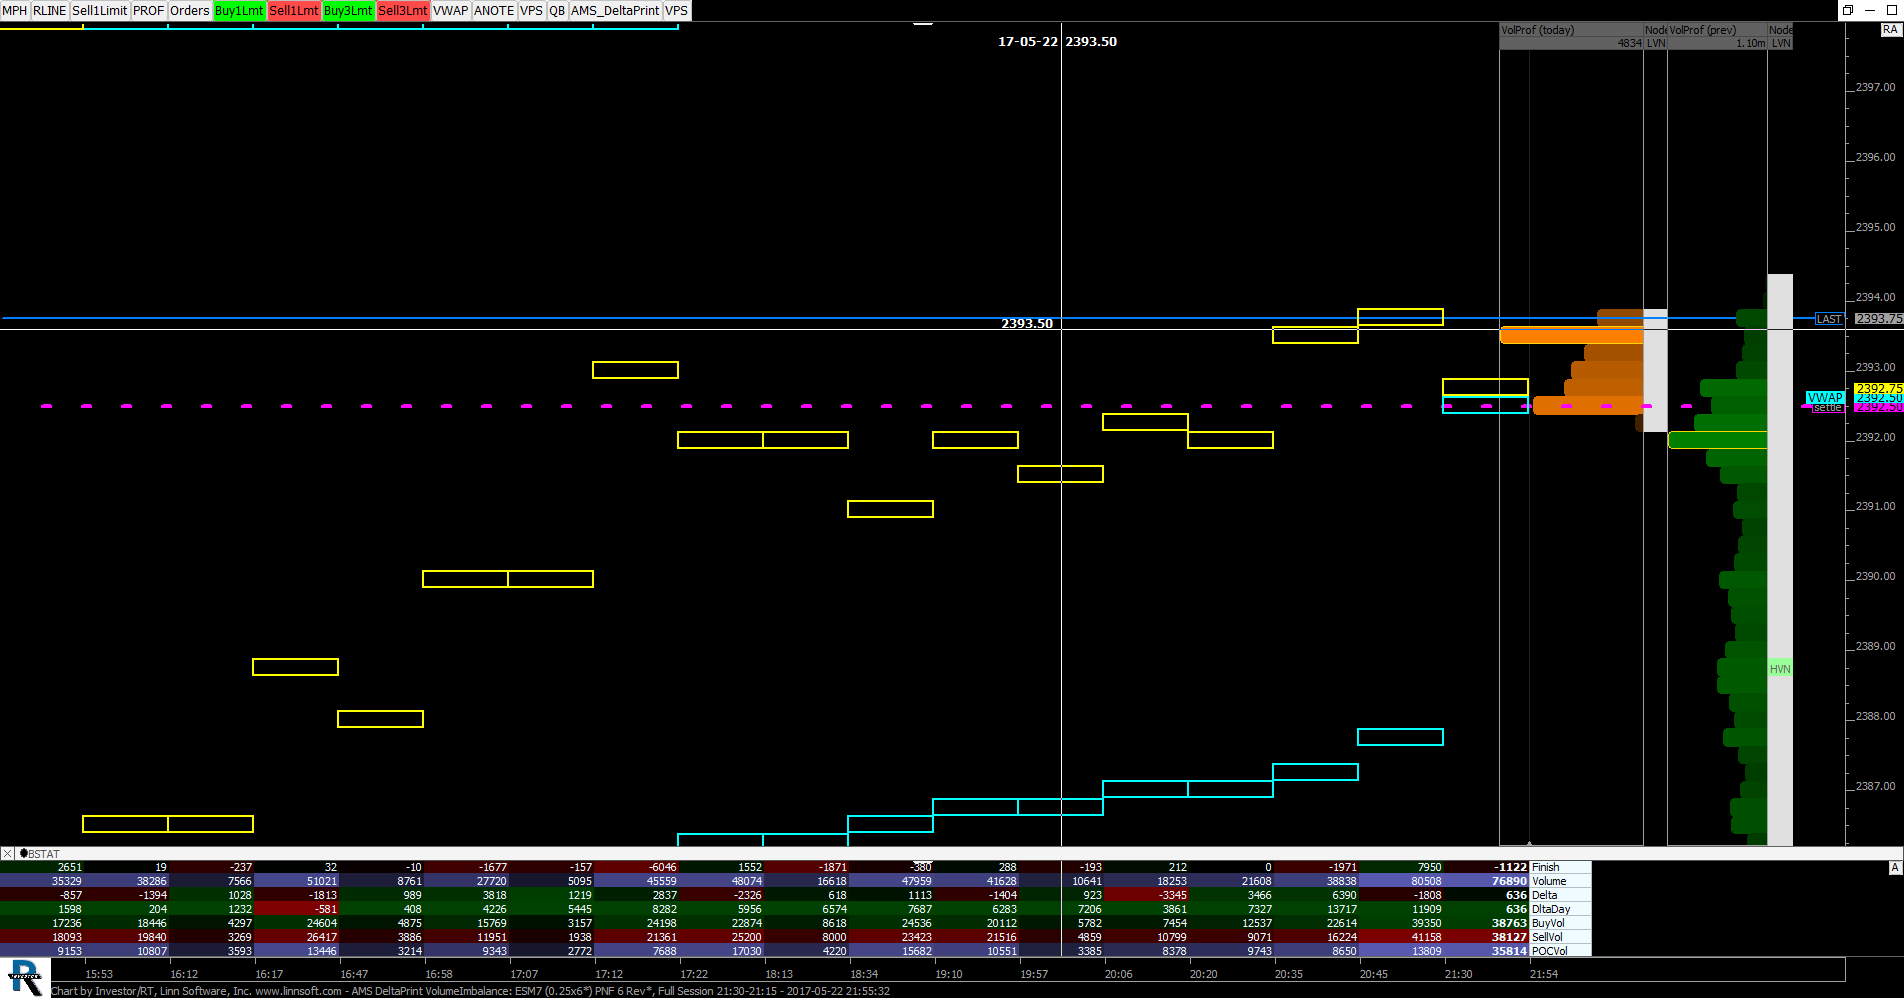 |
AMS DeltaPrint VolumeImbalance (ESM7) Stumpy68 [totalcount]
7 years 11 months ago
AMS DTG. This chart was uploaded by Investor/RT 12.7.3 showing symbol: ESM7. |
View |
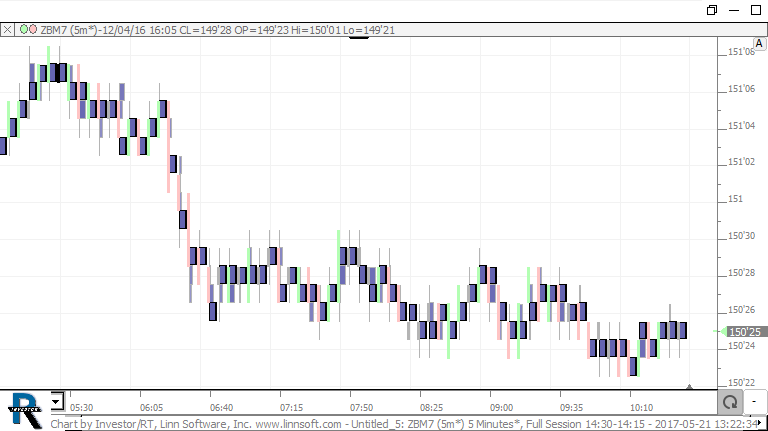 |
Untitled 5 (ZBM7) bob broughton [totalcount]
7 years 11 months ago
This chart was uploaded by Investor/RT 12.7.3 showing symbol: ZBM7. |
View |
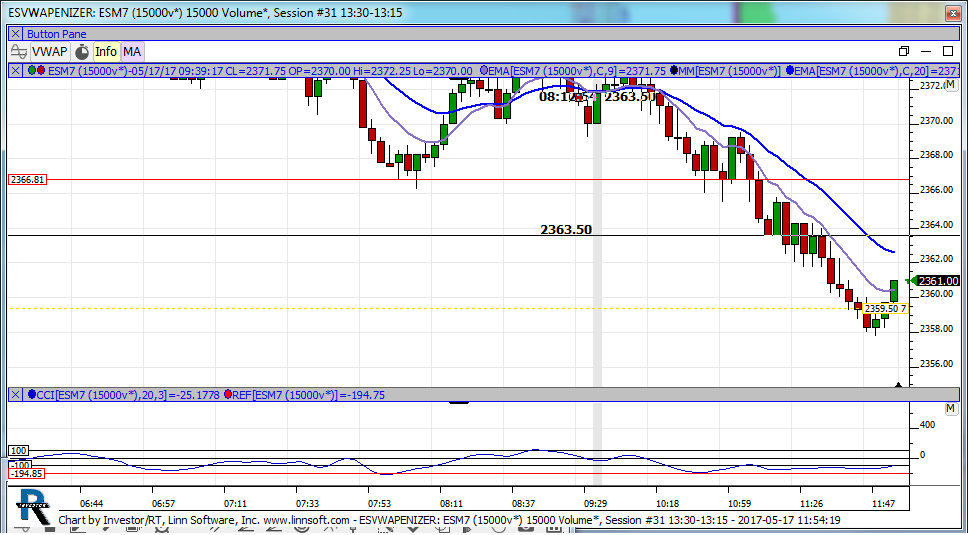 |
ESVWAPENIZER (ESM7) ouci333 [totalcount]
7 years 11 months ago
ES_F MARKET PROFILE RTH. This chart was uploaded by Investor/RT 12.6.8 showing symbol: ESM7. |
View |
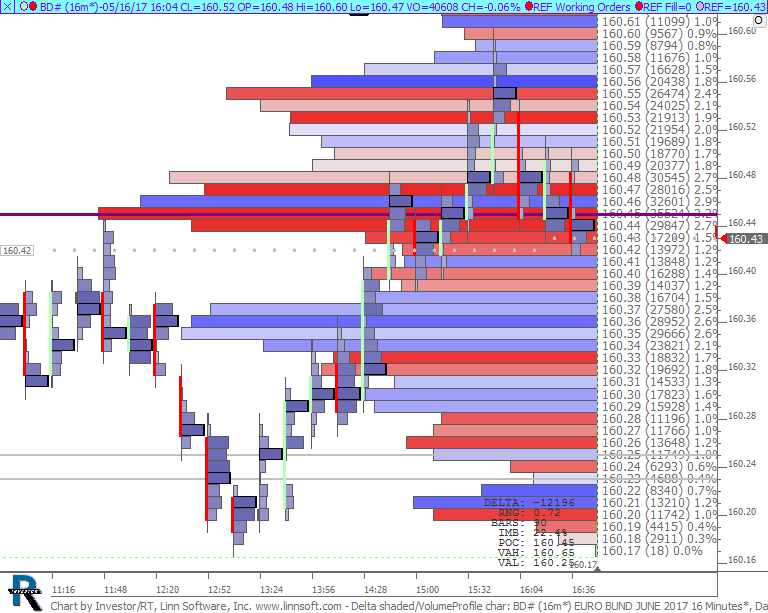 |
Delta shaded VolumeProfile char (BD#) WAYNE CHANDLER [totalcount]
7 years 11 months ago
Delta shaded profile combined with a VolumeProfile chart. This chart was uploaded by Investor/RT 12.7.3 showing symbol: BD#. |
View |
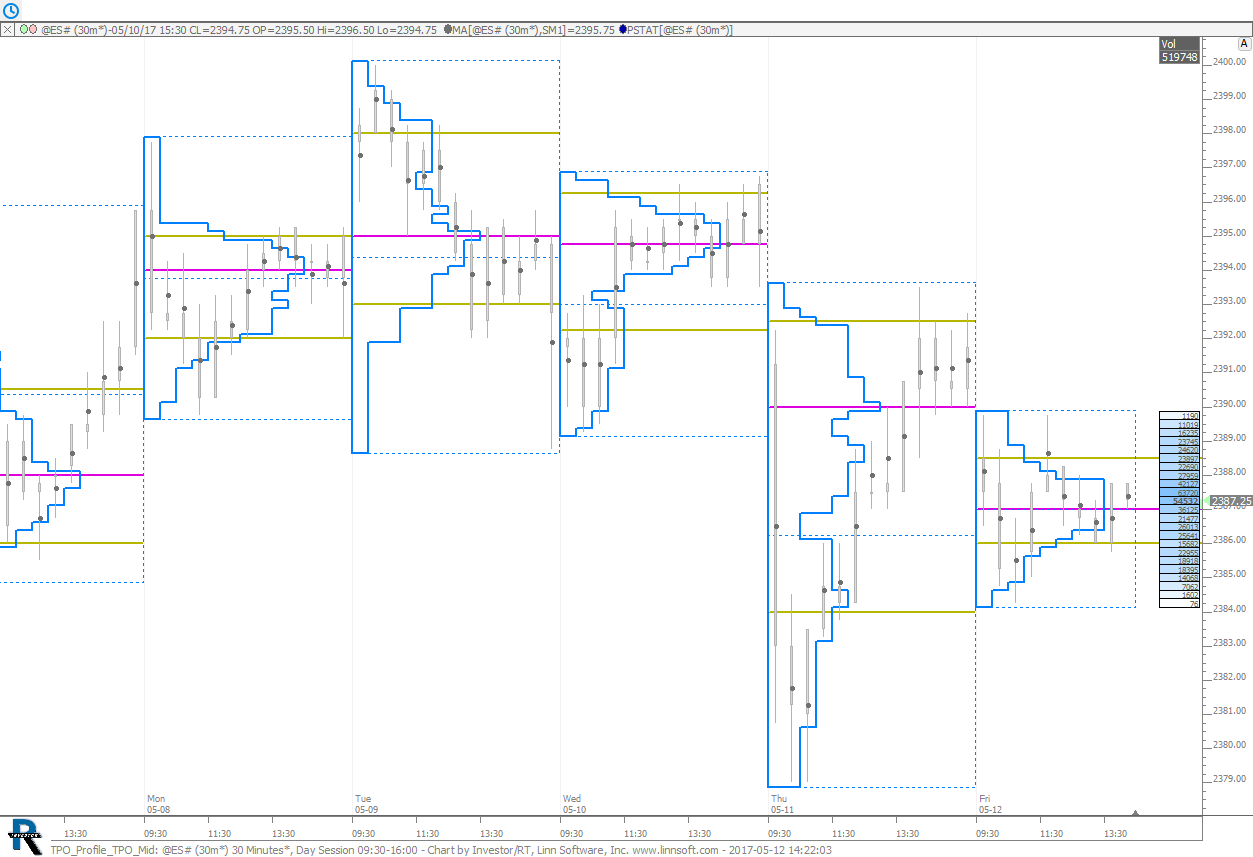 |
TPO Profile TPO Mid (@ES#) cpayne [totalcount]
7 years 11 months ago
TPO Profile with mid of each bracket marked. This chart was uploaded by Investor/RT 12.7.3 showing symbol: @ES#. |
View |
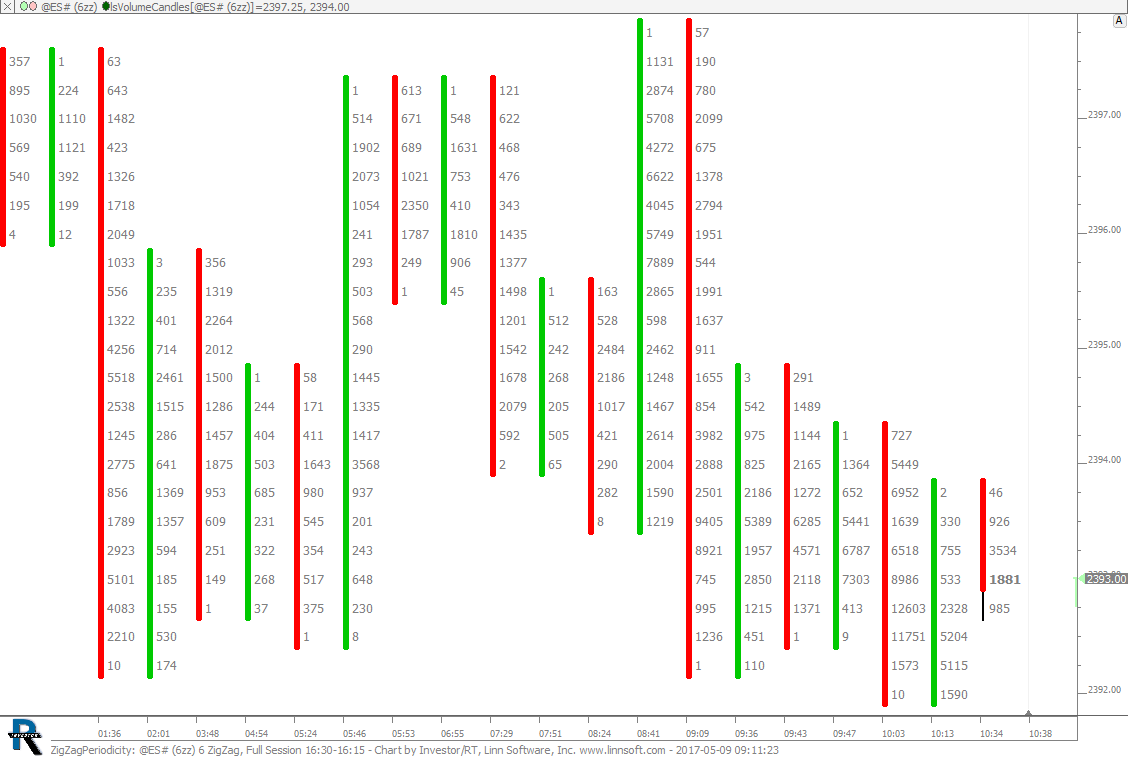 |
ZigZagPeriodicity (@ES#) cpayne [totalcount]
7 years 11 months ago
Zig Zag Periodicity. This chart was uploaded by Investor/RT 12.7.3 showing symbol: @ES#. |
View |
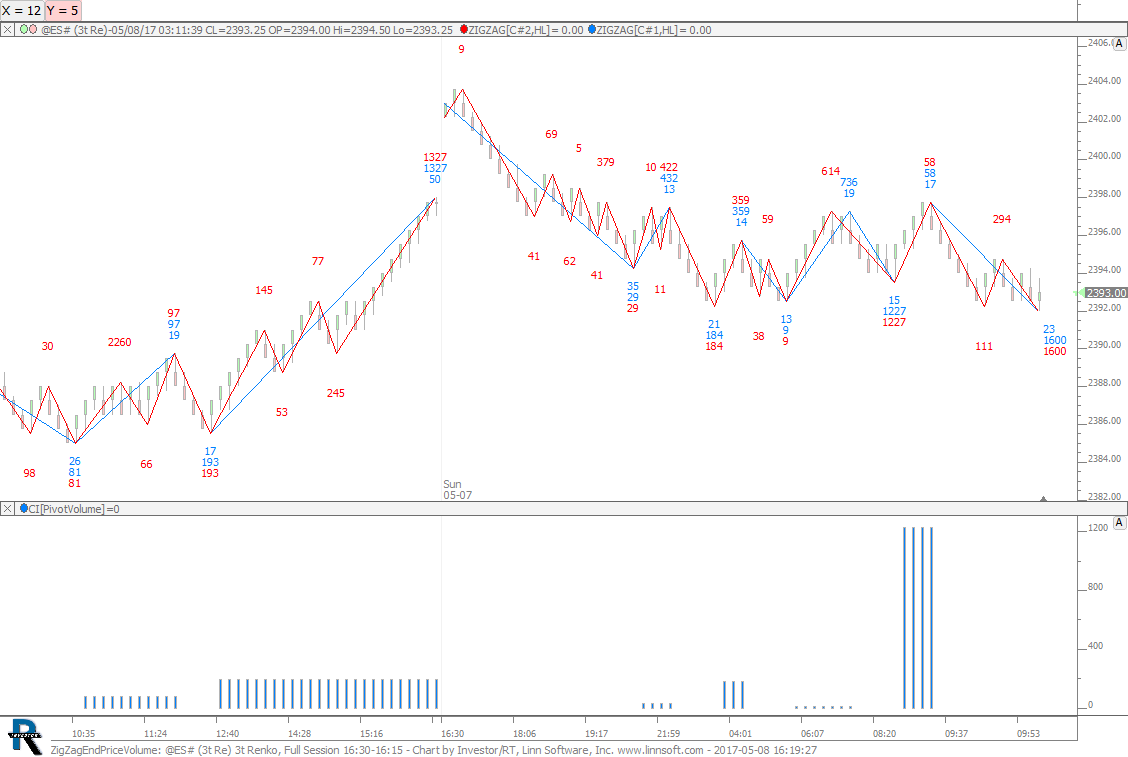 |
ZigZagEndPriceVolume (@ES#) cpayne [totalcount]
7 years 11 months ago
End Price Volume. This chart was uploaded by Investor/RT 12.7.3 showing symbol: @ES#. |
View |
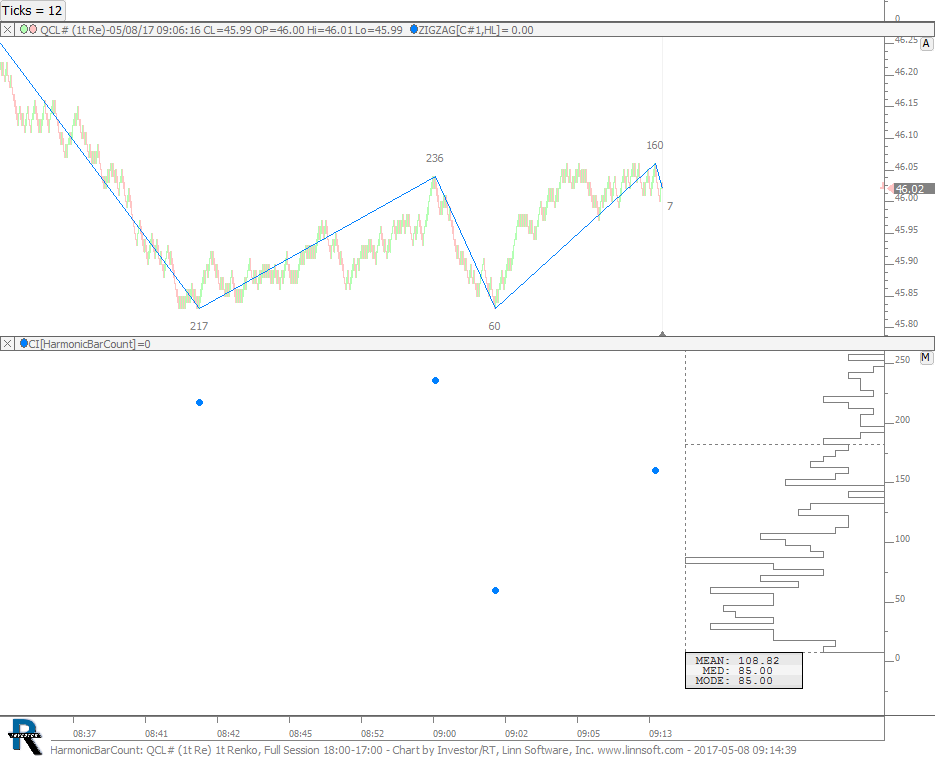 |
HarmonicBarCount (QCL#) cpayne [totalcount]
7 years 11 months ago
Harmonic Bar Count. This chart was uploaded by Investor/RT 12.7.3 showing symbol: QCL#. |
View |
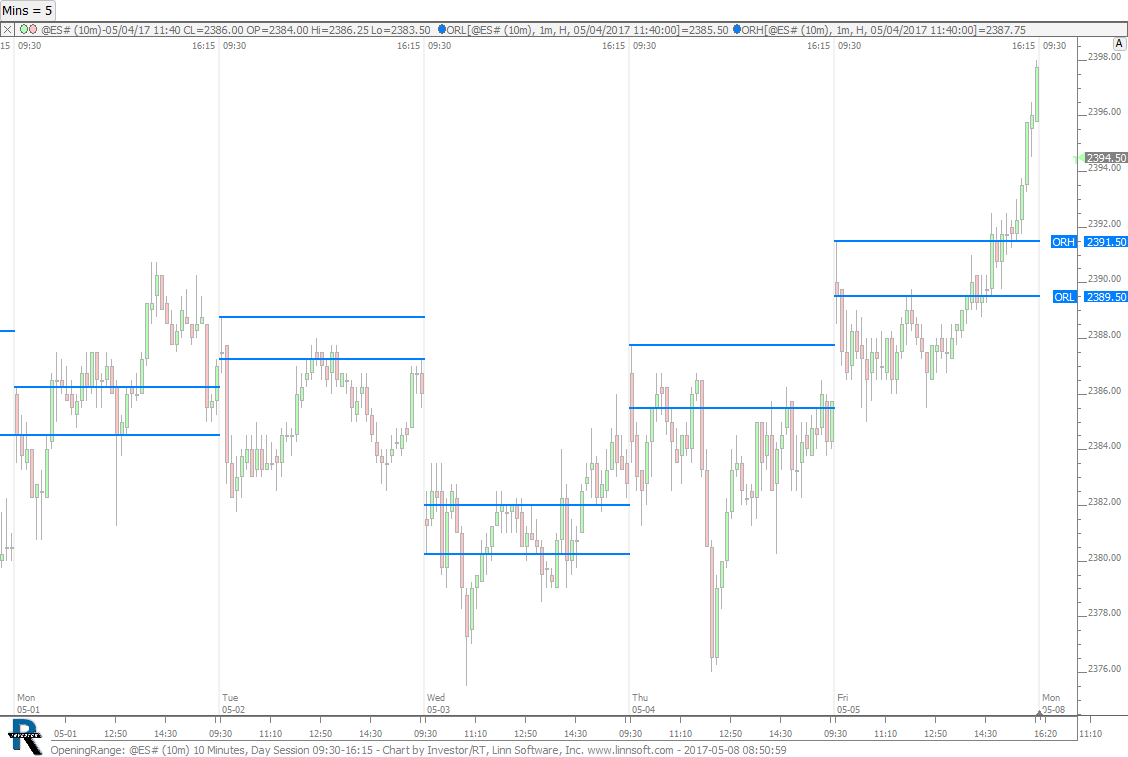 |
OpeningRange (@ES#) cpayne [totalcount]
7 years 11 months ago
Opening Range System. This chart was uploaded by Investor/RT 12.6.1 showing symbol: @ES#. |
View |
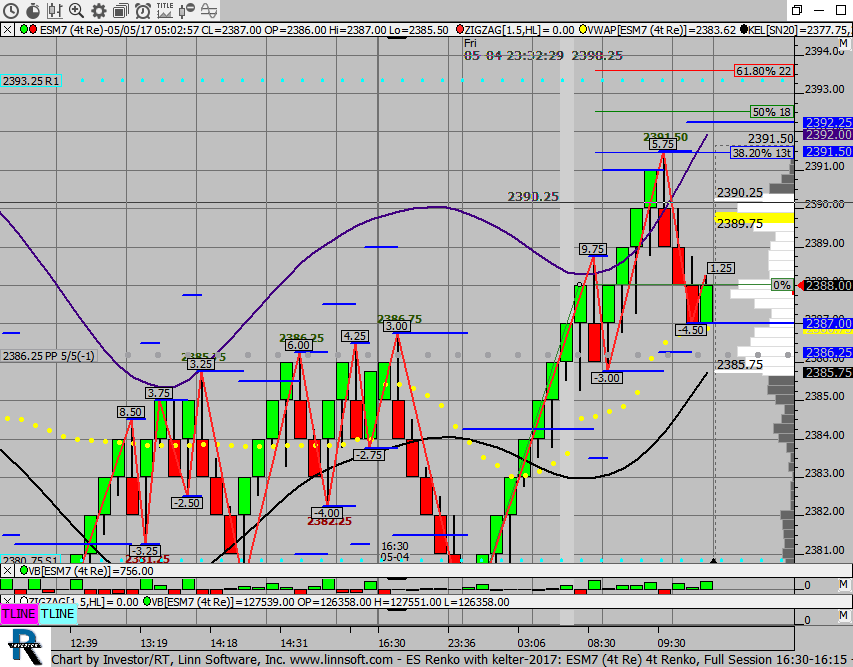 |
ES Renko with kelter (ESM7) Quantum Leap [totalcount]
7 years 11 months ago
This chart was uploaded by Investor/RT 12.7.2 showing symbol: ESM7. |
View |