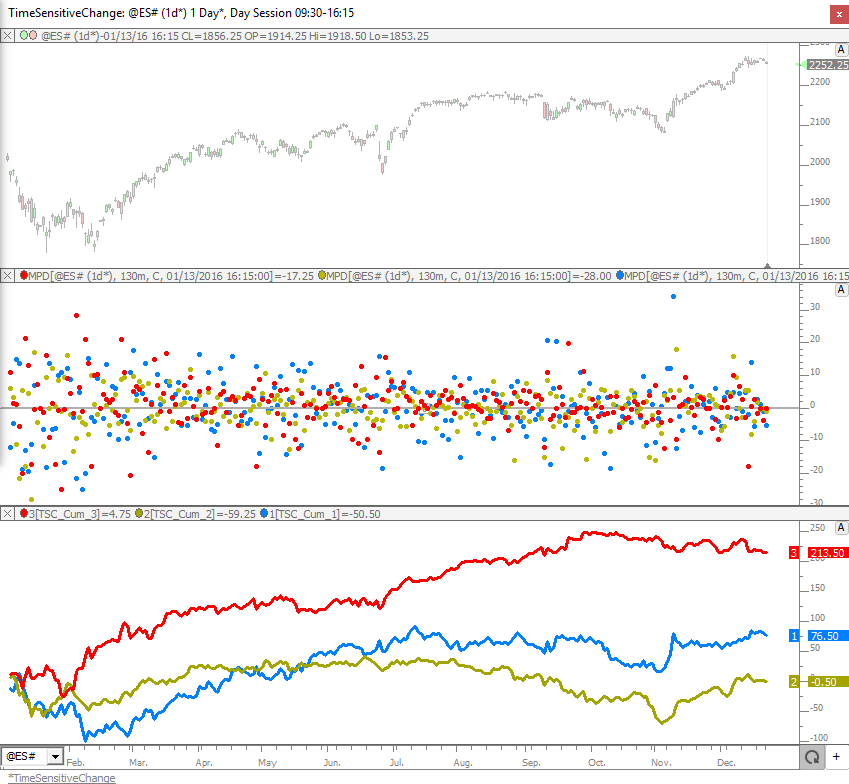
This chart accumulates the change by time of day, dividing the session into 3 130 minute periods (9:30am to 11:40am in blue, 11:40am to 1:50pm in gold, 1:50pm to 4:00pm ET in red). The middle pane shows the per day change for each respective time period. The bottom pane accumulates those per day changes. Chart is currently set to view last 250 days but view period may be adjusted to any period of time. This specifc chart tells us that during 2016 (250 trading days), The cumulative change for the 9:30am to 11:40am period for ES was +76.50, for 11:40am to 1:50pm the change was -0.50, and 1:50pm to 4:00pm the change was 213.50. So the morning period was somewhat bullish. The mid day period was flat. And the afternoon period accounted for the bulk of the day session gains.


This chart breaks down the cumulative change by time of day using 30 minute periods. Use the button at top to control which 30 minute period into the session is being considered (1 for 9:30am to 10:00am ET, 2 for 10:00am to 10:03am ET, etc). Below is a breakdown of the ES for 2016. Of note, 1:00pm to 2:00pm were rather bearish periods, while the last 5 periods were all bullish.
This chart also provides the cumulative change by time of day in 30 minute periods, but showing all time periods on the chart at the same time, plotted in histogram format in bottom pane. The time labels represent then ending time of the each bar (10:00 reflects that bar/period went from 9:30am to 10:00am). The chart below shows the cumulative results for 2016.
This chart shows the average change by day of week for 2016. Tuesdays and Thursdays are particularly strong days on average for the year.
and when looking at median change instead of average change, Thursdays were especially strong.
This Chart plots the change by month, averaging each month (with black lines) since 1998. Blue/Red Histogram shows the change for each month (of 2016). March, November, and February have been historically strong months and that held true in 2016 as well.
https://www.linnsoft.com/charts/dayovernightchangebyyear-es
This chart breaks down the change of the year, between the change that occurred during day session and change that occurred during overnight session.
This chart: https://www.linnsoft.com/charts/changebyanytimeofday-es
Allows the user to specify any start and stop time using the buttons at top. The middle pane shows the change during that time period for each day, and the lower pane shows the cumulative change for that time period of all days.