Price Based

Indicators that study price movement with the goal of showing when an instrument is overbought or oversold.

Random Walk Index

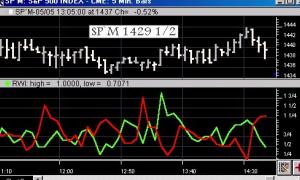
The Random Walk indicator is used to determine if an issue is trending or in a random trading range. It attempts to do this by first determining an issue's trading range. The next step is to calculate a series of RWI indexes for the maximum look-back period. The largest index move in relation to a random walk is used as today's index. An issue is trending higher if the RWI of highs is greater than 1, while a downtrend is indicated if the RWI of lows is greater than 1.

PNF (Point And Figure Indicator)

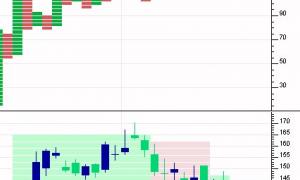
The Point and Figure Indicator calculates columns just like the Point And Figure Charts. There are however a couple of advantages to being able to add PNF as an indicator on a chart. First, you can overlay the traditional bar data on top of the PNF data to see exactly where in time the reversals occurred and the amount of time that was spent in each column. Also, this provides the ability to apply all other technical indicators to PNF data, such as moving averages, reference lines, etc.

Normalized Price

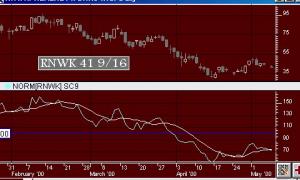
The Normalized Price indicator graphs the price movement of an instrument using 100 as the base value for a user specified base date/time. The normalized value for each bar after the base date/time is the percent of the base price expressed as a whole number. (i.e. 100 times actual price divided by actual base price) This indicator shows the percentage move in price relative to some fixed starting point. For example, if you add this indicator to a daily chart using 12/31/99 as the based date, the indicator line will show you how the issue has performed since the beginning of year 2000.

Momentum Indicator

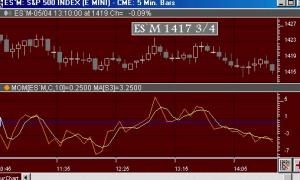
The momentum indicator is a measure of price change velocity. It is a simple calculation. For each bar the momentum is calculated as the difference in price between that bar and the bar a fixed number of periods ago. Normally the closing price is used but Investor/RT allows you to calculate the indicator using other price values (e.g. high, low, median price, etc.). Investor/RT also provides an optional smoothing moving average of the raw momentum calculation. Either or both lines, raw and smoothed may be drawn on the chart. The momentum line(s) oscillate around the zero line.

Money Flow (MFLO)

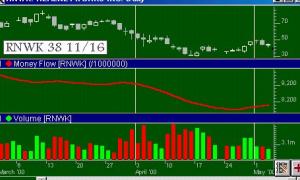
A technical indicator that keeps a running total of the money flowing into and out of a security. Money flow (MF) is calculated by multiplying the number of shares traded by the change in closing price. If prices close higher, money flow increases (by an amount equal to average price * volume / volume divisor). If prices close lower, money flow decreases (by an amount equal to average price * volume / volume divisor). Average price is equal to the average of the high, low, and closing prices. A running total is kept by adding or subtracting the current result from the previous total.

Fishy Turbo

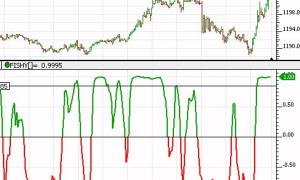
The Fishy Turbo is another name for John Ehler's "Inverse Fisher Transform of RSI" which was detailed in the May 2004 edition of TASC magazine.

Resulting values range between 1.0 and -1.0 with bullish triggers occurring at crossovers of -0.5 and bearish triggers of 0.5.

Donchian Channels

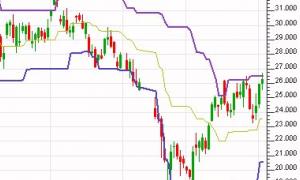
Donchian Channels were introduced by Richard Donchian, a pioneer in the field of trend following. The Donchian Channel is a simple trend following breakout system. The Donchian Channel works well in trending markets, but doesn't work well in a sideways channel. The signals derived from the Price Channel are based on the following basic rules:

Detrended Oscillator (DTREND)

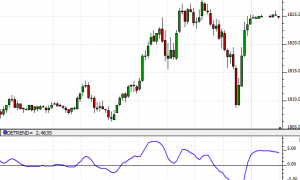
The Detrended Oscillator is calculated by first calculating the difference between "price" and a user specified moving average of "price" for the instrument. The price used may, of course, be the high, low, close, open, average of high and low, or average of high, low, and close. The resulting array of differences is then smoothed according to another user specified moving average. The resulting indicator oscillates around zero. This indicator makes it easy to spot situations when an instrument is trading at historical extremes relative to its average price.

Darvas Box (DBOX)

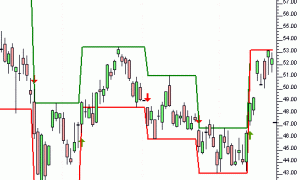
The Darvas Box is considered by some to be a trading system wrapped up into a single indicator. The indicator uses a series of five states to draw the upper and lower lines of a box by finding highs and lows.

Center Of Gravity (COG)

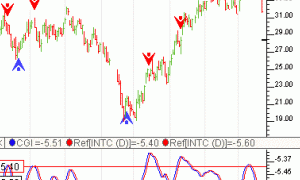
COG is an oscillator based on an article by John F. Ehlers on page 20 of the May 2002 issue of Stocks and Commodities Magazine. COG has essentially zero lag and enables clear identification of turning points. This indicator is a result of Ehlers research into adaptive filters. The Investor/RT implementation of COG includes an option to "Volume Weight" the oscillator. When this option is checked, volume will be used in addition to price to weight the indicator.

Pages