Price Based

Indicators that study price movement with the goal of showing when an instrument is overbought or oversold.

Chaikin Money Flow (CMF)

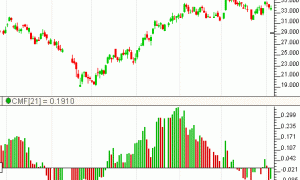
The Chaikin Money Flow indicator (CMF) is calculated by summing Accumulation Distribution over the given period and then dividing by the sum of volume over the given period, as can be seen in the formula section above. A period of 21 is recommended. The volume is essentially nothing more than volume times change divided by range. A positive CMF value signals accumulation, while a negative CMF value signals distribution. A reference line is drawn at zero to help quickly identify accumulation/distribution regions.

Choppiness Index

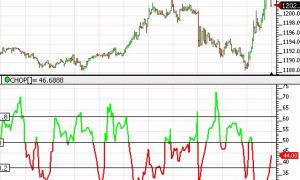
The Choppiness Index is designed to measure the market's trendiness (values below 38.20) versus the market's choppiness (values above 61.80). When the indicator is reading values near 100, the market is considered to be in choppy consolidation. The lower the value of the Choppiness Index, the more the market is trending. The period supplied by the user dictates how many bars are used to compute the index.

CCI Commodity Channel Index

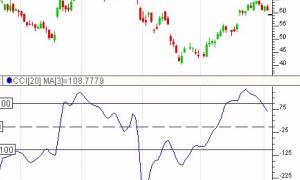
The Commodity Channel Index (CCI) is a price momentum indicator developed by Donald R. Lambert in 1980. It is designed to detect beginning and ending market trends. CCI represents the position of current price relative to the average of price over a recent period. Lambert discussed CCI in detail in a 1980 article in Stocks and Commodities V.1:5(120-122). The CCI usually falls in a channel of -100 to 100. The conventional CCI trading system works as follows. When it rises above 100, buy and hold until CCI falls back below 100.

Candle Codes

The Candle Code indicator is used to assign a numerical value to each candle based on five candlestick characteristics, including Body Color, Body Size, Upper Shadow, Lower Shadow, and Gap. Positive candle code values represent bullish candles while negative candle code values represent bearish candles. The more positive the code, the more bullish the candle. The more negative the code, the more bearish the candle. Each of the five candle characteristics can be weighted according to the user's preferences.

Balance of Power (BOP)

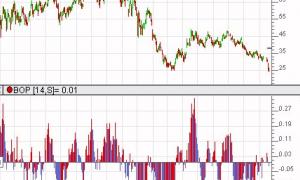
Balance of Power, introduced by Igor Livshin, attempts to measure the strength of buyers vs. sellers by assessing the ability of each to push price to an extreme level. Livshin published this indicator in the August 2001 issue of Stocks and Commodities Magazine. The article describes a somewhat involved calculation of the BOP, but in essence, BOP calculates raw values for each bar as:

(CLOSE- OPEN) / (HIGH - LOW)

The resulting raw BOP values can be optionally smoothed using any moving average type and drawn as a line or histogram.

Bull Power (BULLP)

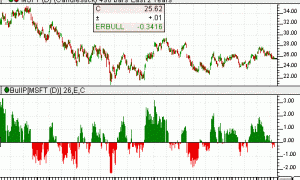
Elder-Ray Method "Elder-Ray" is a technical analysis method developed in 1989 by Dr. Alexander Elder. Dr. Elder, a medical doctor by training, chose the name "Elder-Ray" as a parallel to "X-Ray", since the purpose of the analysis is to look beneath the surface of the market. An exponential moving average (EMA, 13-period) and two other technical indicators, called Bull Power and Bear Power are used in the analysis. Bull Power is simply the difference between the high of each bar and the EMA, while Bear Power is the difference between the low of each bar and the EMA.

Bear Power (BEARP)

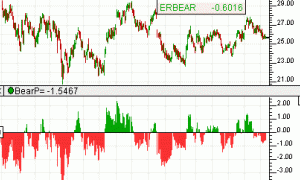
Elder-Ray Method "Elder-Ray" is a technical analysis method developed in 1989 by Dr. Alexander Elder. Dr. Elder, a medical doctor by training, chose the name "Elder-Ray" as a parallel to "X-Ray", since the purpose of the analysis is to look beneath the surface of the market. An exponential moving average (EMA, 13-period) and two other technical indicators, called Bull Power and Bear Power are used in the analysis. Bull Power is simply the difference between the high of each bar and the EMA, while Bear Power is the difference between the low of each bar and the EMA.

Automatic Trendlines

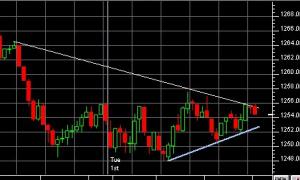
The automatic trend line indicator determines the current up trend and down trend line and draws them. Trend lines may also be drawn manually using the drawing tool on the charting toolbar, but this indicator does it automatically. The user specifies the number of periods to "look back" from the present to determine where to place the trend lines. The up trend line connect the lowest low in the user specified period with the next lowest low preceding the highest high for which the trend line is not penetrated.

Aroon (ARN)

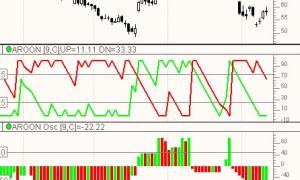
The Aroon indicator was developed by Tushar Chande in 1995. Aroon is used to measure the presence and strength of trends.

Aroon can be drawn either as two lines, the AroonUp and AroonDown, or an Aroon Oscillator representing the difference between the AroonUp and the AroonDown lines. The AroonUp and AroonDown lines oscillate between 0 and 100, while the Aroon Oscillator oscillates between -100 and +100.

Arms Ease of Movement

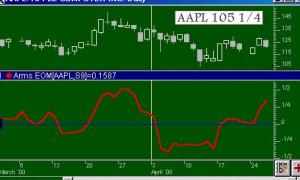
The Arms' Ease of Movement Value (EMV) is a momentum indicator developed by Richard W. Arms, Jr. The indicator takes into account both volume and price changes to quantify the ease (or difficulty) of price movements. The calculation is as follows: EMV = (HI + LO)/2 - (HI1 - LO1)/2 all divided by VOL/(HI-LO) HI, LO, VOL are the high, low, and volume for the current period HI1 and LO1 are the high and low for the previous period The volume is scaled by dividing by a constant divisor, usually 10000. This divisor may be varied by the user in the Arms EMV setup.

Pages