Price Based

Indicators that study price movement with the goal of showing when an instrument is overbought or oversold.

LookBackCandles (RTX)

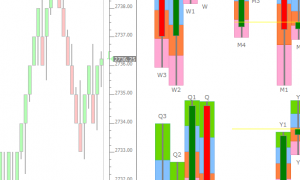
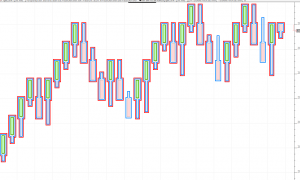
Add the LookBackCandles indicator to your chart to see at a glance how the current trading price relates to various lookback periods of trading: today, this week, this month, last few weeks, etc. Up to 8 lookback periods are shown in one compact display giving the trader both short and long term perspective on price action over various period of the recent past.  LookBackCandles (LBC) can display daily, weekly, monthly, quarterly, and yearly candles; it can depict price action for any lookback period (such as 1 year back, 2 months back).  LBC has an option to utilize its own scale to maximize the vertical space. Or it may share the same scale as the underlying data/instrument plotted in the chart.  Up to 8 periods may be plotted with each instance of LBC and each may be given it's own colors and style or all lookback periods may share the same common colors and style.  Each period may be labeled in order to make it clear what timeframe each bar/candle represents.  A Current Price Line option makes it clear where the current price is in relation to each period, and a Paint Quadrants option allows the background of each of the quadrants of each bar to be drawn in a user-specified color.  All prices computed by LBC may be store into a series of User Variables (V#) that are automatically labeled.  LBC may be aligned to the left or right of the window pane, or dragged into the SideBar by simply dragging onto the scale at the right.

TimeAndSales (RTX)

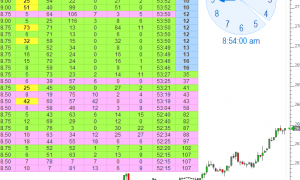
The RTX TimeAndSales extension (TAS)  is used to embed time and sales displays into any Investor/RT chart window. TAS introduces a variety of new time and sales capabilities such as flexible filtering, highlighting and alerting options and much more.  Display columns are user customizable. These include new data items of interest to traders: Skips, Bid Volume, Ask Volume, Age, Ticks Back and Consolidated Trades.

SlopeLines (RTX)

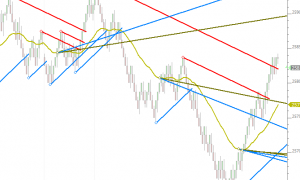
Trendlines are one of the basic trading tools used to follow trends in market data. They are easy to draw in Investor/RT using the trendline drawing tool: click on a starting point; drag and drop on the ending point. Investor/RT has some trendline automation features as well that attempt to determine the current trend and auto draw lines to depict the trend. Introducing SlopeLines - a new tool that takes trendline automation to the limit.

Zones (RTX)

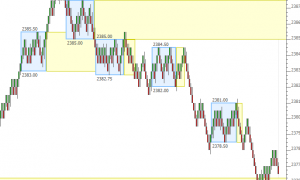
The Zones Indicator is designed to automate the identification of zones between a range of prices over a series of bars/time. The primary motivation for the creation of this indicator is to identfy consolidation zones where price remains in a given range over a minimum period bars or time. An Extend Naked option extends the zones until the zone is filled by future price movement. As an example, Zones can identify when price remained in a 10 tick range over a series of 20 bars or more, and once breaking that range, it can extend the naked band until price moves back across the zone.

Price Statistics

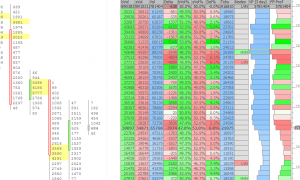
The Price Statistics Indicator presents cumulative volume based information textual for each price over any user-specified period of time (days or bars).

True Strength Squeeze (RTX)

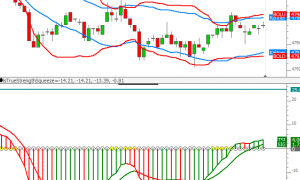
The TrueStrengthSqueeze (RTX) Indicator combines the True Strength Index with the Squeeze Indicator.  The True Strength Index attemps to show both trend direction and overbought or oversold conditions using double-smoothing of momentum relative to double-smoothing of the absolute value of momentum.  The Squeeze Indicator identies when the Bollinger Bands are within the Keltner Channel.  Both Bollinger Bands and Keltner Channels center about a moving average of the close with the Bollinger Bands using a multiple of standard deviations and the Keltner Channels using a multiple of Average True

Divergence (RTX)

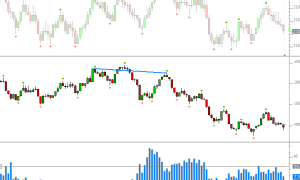
The Divergence RTX indicator quantifies divergence with a numerical value between two data series using various methods. Each data series may consistent of either price data, cumulative delta filtered, filtered cumulative delta, or any other indicator available in Investor/RT.

Pivot Strategy Optimizer (RTX)

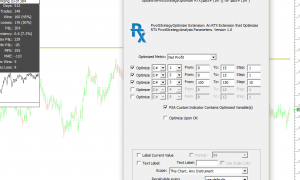
The PivotStrategyOptimizer (PSO) builds upon the PivotStrategyAnalysis (PSA) indicator to create an extremely powerful combination. PSO enables the optimization of any combination of a number of variables within PSA, allowing the user to quickly determine the optimal combination of values which would have resulted in maximized profits. PSO can optimize the target, stop, reset distance, frontrun wiggle, allowable trading hours, number of allowable trades/day, or an infinite array of other variables within the custom indicator upon which the PSA is based.

Paint Candles (RTX)

The PaintCandles RTX Extension decorates candlesticks in a variety of ways. The user may choose to decorate all candles or just those candles that meet a specific condition determined by an RTL Signal . Decoration options include the width in pixels, the Position relative to the candle (in pixels offset from candle) and whether to draw inside or outside of the candle.  Up to 4 painting options are available in each instance of PaintCandles, one to decorate all candles and three options to decorate candles based on an RTL Signal being true for that candle (bar).

Pivot Strategy Analysis (RTX)

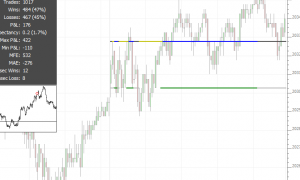
The PivotStrategyAnalysis (PSA) RTX Extension allows the user to specify any key daily or weekly price level such as previous high, previous close, or overnight VPOC, and analyze the effectiveness of that level as a pivot point during the following session or week.  The indicator provides for a variety of convenient options including stop, target, frontrun wiggle, reset distance, nature of system, trade limits, and time filters.  The frontrun wiggle determines how far ahead of the level, if any, to enter the trade (defaults to 0).

Pages