LookBackCandles (RTX)

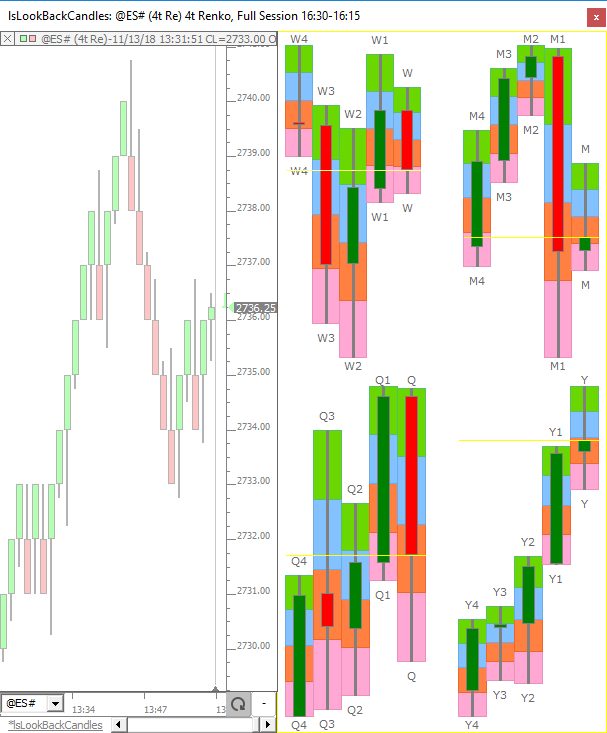
Add the LookBackCandles indicator to your chart to see at a glance how the current trading price relates to various lookback periods of trading: today, this week, this month, last few weeks, etc. Up to 8 lookback periods are shown in one compact display giving the trader both short and long term perspective on price action over various period of the recent past. LookBackCandles provides a broader perspective on price action inside charts of any timeframe.  LookBackCandles (LBC) can plot daily, weekly, monthly, quarterly, and yearly periods and can plot current period or any prior period in the past (such as 1 year back, 2 months back).  LBC has an option to utilize its own scale to maximize the vertical space, or it may share the same scale as the underlying data/instrument plotted in the chart.  Up to 8 periods may be plotted with each instance of LBC and each may be given it's own colors and style or all periods may share the same common colors and style.  Each period may be labeled in order to make it clear what timeframe each bar/candle represents.  A Current Price Line option makes it clear where the current price is in relation to each period, and a Paint Quadrants option allows the background of each of the quadrants of each bar to be drawn in a user-specified color.  All prices computed by LBC may be store into a series of User Variables (V#) that are automatically labeled.  LBC may be aligned to the left or right of the window pane, or dragged into the SideBar by simply dragging onto the scale at the right.

Presentation
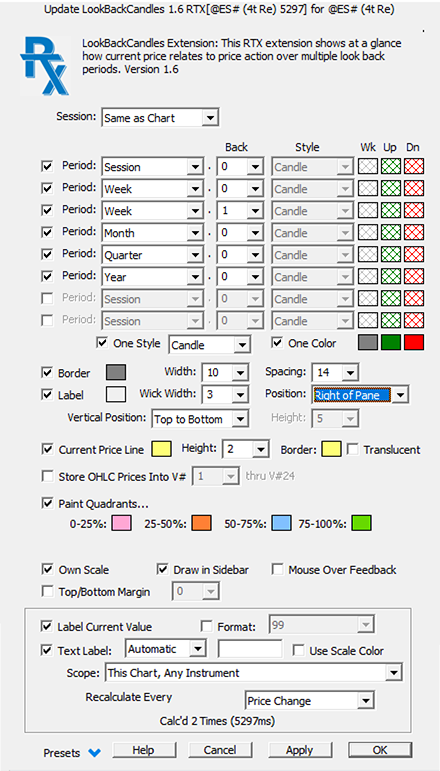
LookBack Candles Prefs

  • Session - When building the data of each period, options exist to build using Same session as Chart, or to force the data to Day Session or Full Session.
  • Period - Up to 8 periods (candles) may be drawn with each instance of BP, with each period representing a day, week, month, quarter, or year, with options to to reflect current period (Bars back = 0) or any prior period (Bars back > 0).  All periods may share a style and color or each may be given it's own unique style and color..
  • One Style / One Color - Check these to force the same style and/or color on each period.
  • Border - Border Color for each period/candle.
  • Width / Spacing - Width of each period/candle as well as the amount of space between each period/candle.
  • Label - Label color that is placed above and below each period/candle (D for Daily, W for Weekly, W1 for 1 Week Back, etc).
  • Wick Width - Width of the candle wicks.
  • Position - Options to place the BP on left or right of chart pane.
  • Curent Price Line - Color and height of currrent price line drawn across each period.
  • Store OHLC Prices Into V# - Option to store the prices of BP into a series of User Variables (V#).  Each V# will be automatically titled.
  • Paint Quadrants - Paints 25% quadrants of each period in 4 user-defined colors.
  • Own Scale - When checked, the BP will use it's own scale to make maximum use of the vertical space of the pane or the SideBar.  When unchecked, the BP will share the scale with the data in the chart pane.  Own Scale is forced on when BP is drawn in the SideBar.
  • SideBar - Draw the BP in the SideBar to right of the scale.
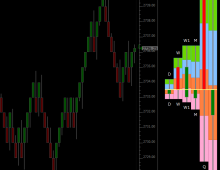
lsLookBackCandles (@ES#)
LookBackCandles. This chart was uploaded by Investor/RT 13.5.10 showing symbol: @ES#.

Read more Download

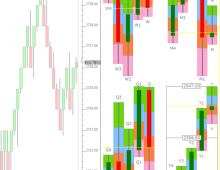
LookBackBeyond (@ES#)
LookBackCandles and Beyond. This chart was uploaded by Investor/RT 13.5.10 showing symbol: @ES#.

Read more Download

Pop-up Video Description View
LookBackCandles (RTX)

LookBackCandles shows at a...

 Watch