Bar Statistics is a component of the Volume Analysis package.
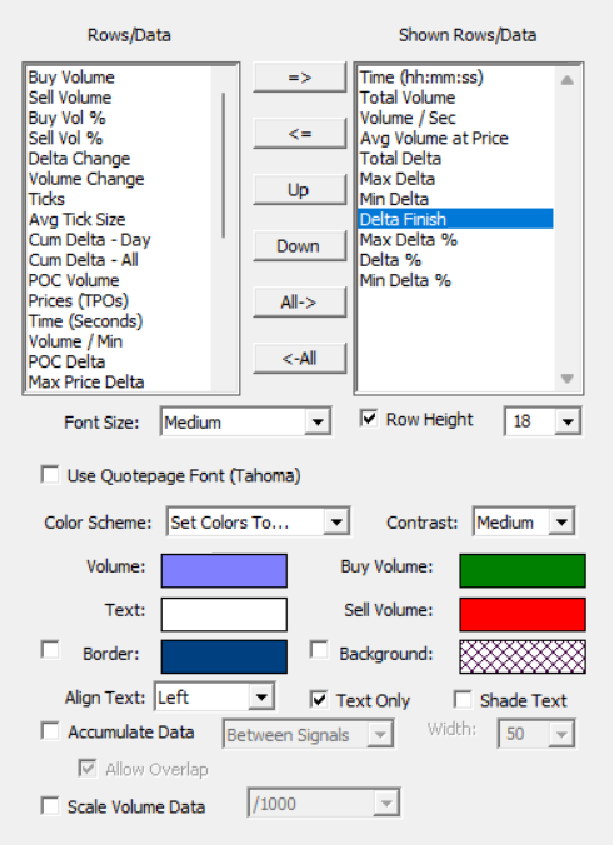
The indicator presents cumulative volume-based textual information for each bar. Data items include Buy Volume, Sell Volume, Total Volume, Max Delta, Min Delta, Total Delta, Buy Vol %, Sell Vol %, Delta %, Delta Change, Volume Change, Ticks, Avg Tick Size, Cum Delta-Day, Cum Delta-All, POC Volume, Prices (TPOs), Avg Volume at Price, Time (Seconds), Delta Finish, Max Delta %, and Min Delta %. Any or all of these data rows may be displayed and in any order the user wishes. Each data item is shaded based on the relative value of the data item and custom colors are available for buy volume, sell volume, volume, and text. User may choose from 4 different font sizes: Small, Medium, Large and Extra Large, and an option is available to use the font style of quotepages which is specified in Setup: Preferences: Quotepage Defaults. For more information on what each data item provides, visit the Preferences tab.
Presentation

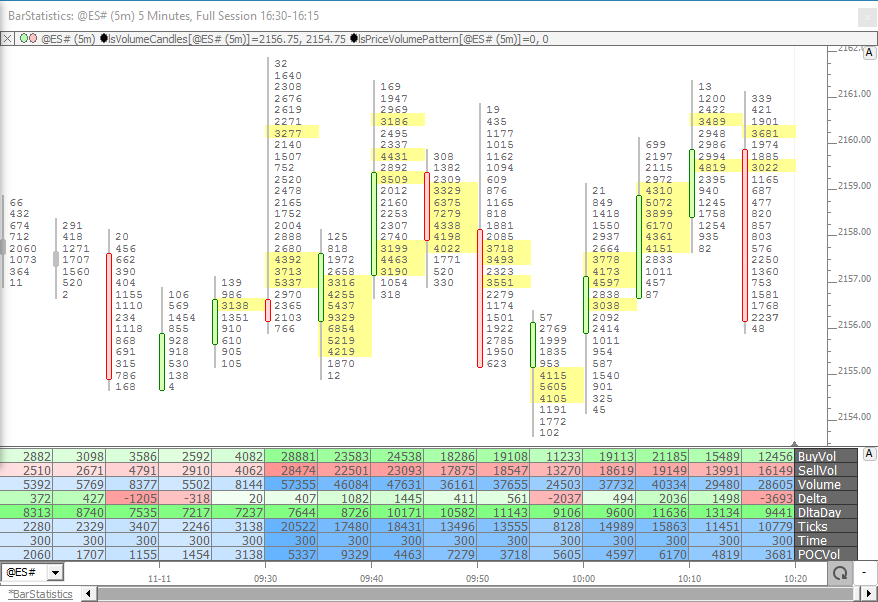
The chart above displays the Bar Stastistics Indicator in the lower pane. The upper pane shows volume at each price using the Volume Candles (RTX) indicator, along with the Price Volume Pattern indicator which highlights high volume prices in yellow.


