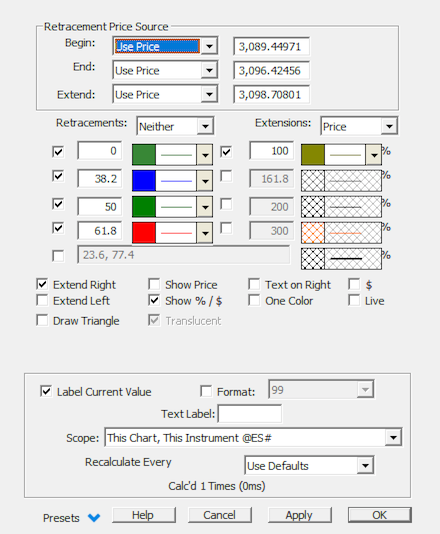
The Fibonacci Extensions tool is similar to the Fibonacci Retracements tool. The Fibonacci Extensions indicator requires a third point. The extensions and retracement levels are drawn from this third point, but based upon the distance between the first two points. A common use of this tool is to first connect two points that represent the endpoints of a major trend (or wave). Then choose the third point to be the endpoint of a retracement of that trend. Extensions are then drawn in the direction of the initial trend, from the third point, using the distance between points one and two as a basis for the extension levels. For example, suppose the initial trendline moved in price from 100 (point 1) to 110 (point 2). Then, price retraced to 105. The 0% extension line would then be drawn at 105 (105 + 0%*(110 - 100)). A 100% extension line would be drawn at 115 (105 + 100%*(110 - 100)). A 50% extension line would be drawn at 110 (105 + 50%*(110 - 100))...and so on. The Fibonacci Extensions toolbar button and drawing tool work much like the Andrew's Pitchfork drawing tool. First, click on the Fibonacci Extension button on the toolbar. Then, click three times, once on each of the points that are involved in the Fibonacci Extension. The first click should be on the starting point of the initial trendline. The second click should be on the ending point of the initial trendline. The third click should be on the ending bar of the retracement period. As with Fibonacci Retracements, there is a great deal of flexibility for all three price points (Begin, End, and Extend Prices). Each price level can have "Use Bar" or "Use Price" selected. If "Use Bar" is selected, the endpoints will snap to the extreme prices of the corresponding bars. If "Use Price" is selected, the exact price at each mouse click point will be used. Fibonacci Extension share the same flexibility as Fibonacci Retracements regarding "Show Price", "Show %", "Extend Left", "Extend Right", "Text on Right", etc. Also, both retracements and extensions in both time and price may be drawn.
Presentation

Above is a Daily Chart of an Microsoft Corporation (MSFT). The diagonal red line represents a trendline between two extreme points, based on the date-time ranges specified below. The horizontal trendlines represent the Fibonacci Levels selected in the preferences example on this page.
Keyboard Adjustment
The keyboard can be used to move the first trendline points to the right and left. First, click on the chart. Then hit the tab key repeatedly until you notice your Fibonacci Extension lines are selected. Then, press the right or left arrow keys on your keyboard to move the entire Fibonacci line right or left one bar. To move the trendline up or down, press the up and down arrows on the keyboard. If you would like to move only the endpoint, then hold down the Ctrl key while pressing the right or left arrow keys. If you would like to move only the beginning point, then hold down the Shift key while pressing the right or left arrow keys.


