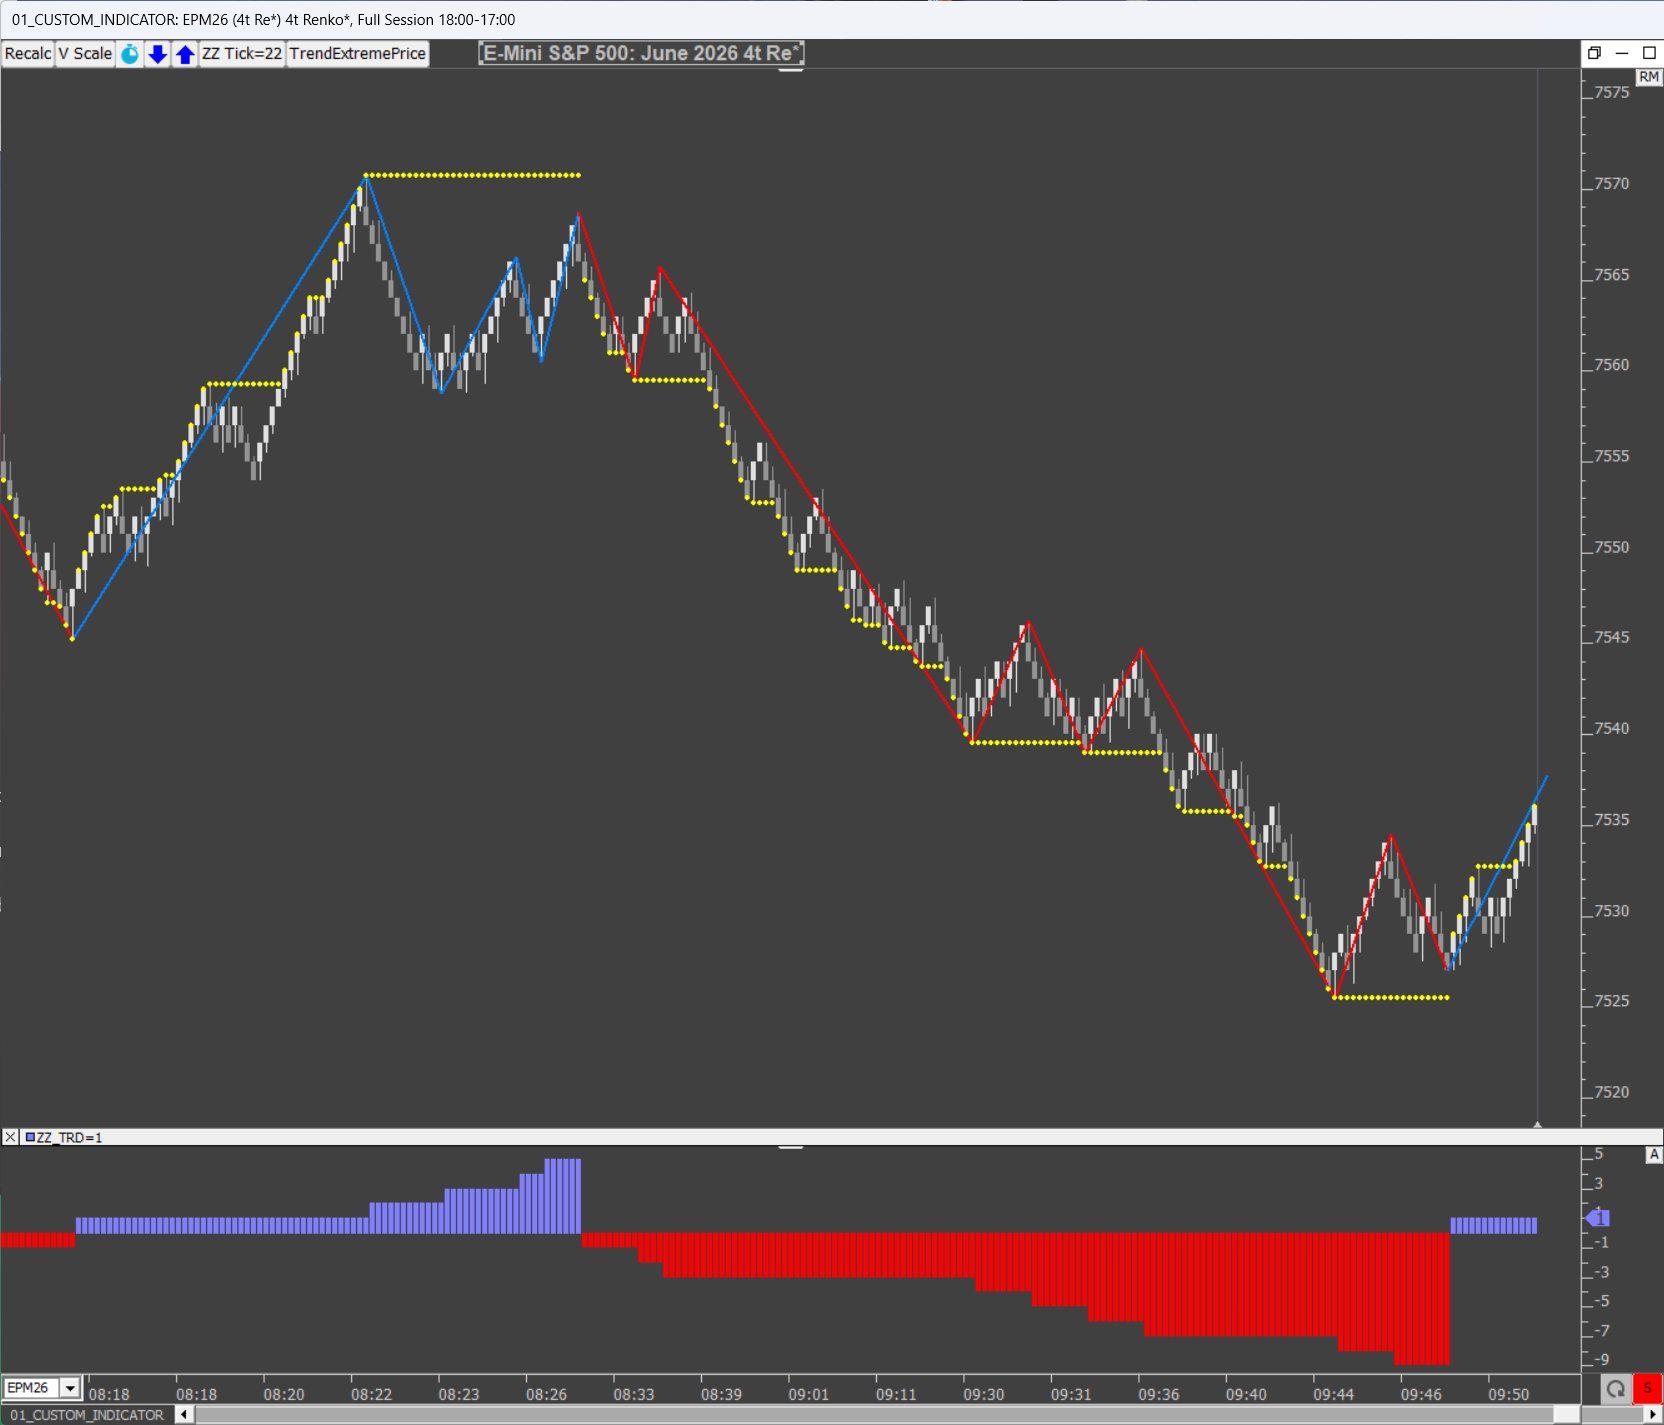
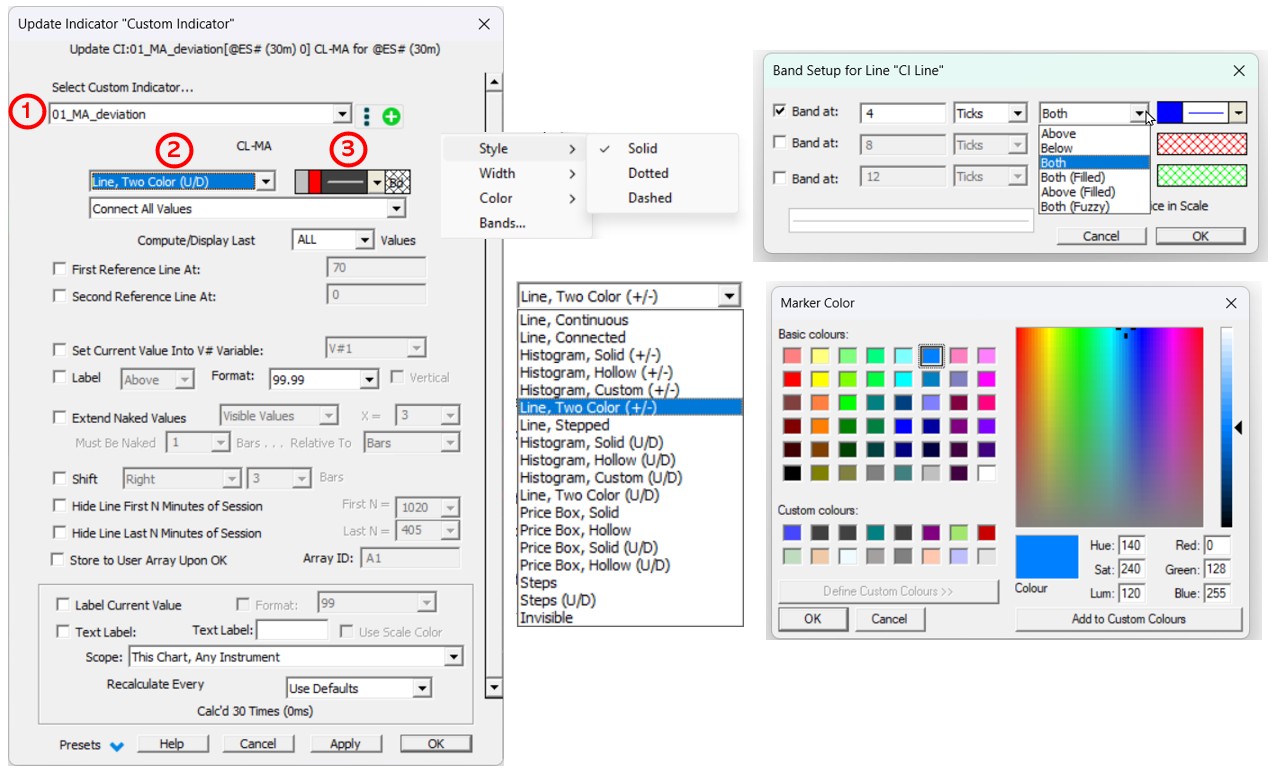
The 3 main inputs for displaying a Custom Indicator are :
1) The Selection menu for the Custom Indicator RTL Formula
2) The Selection menu for the Indicator Drawing Style (Line, Histogram, etc.)
3) The "Style and Color picker" selection box (incl. a Band configuration menu)
The corresponding selection menus are highlighted in this expanded view:
1) Selecting a Custom Indicator Formula
If you need to access the RTL Object editor, either click
2) Selecting an Indicator Drawing Style (Line, Histogram, etc.)
The following naming convention applies when it comes to identifying the main color settings of a drawing style :
(+/-) indicates that the drawing style (Line, Histogram, Price Box, etc) offers a bi-color setting based upon the positive/negative value of the underlying custom indicator
(U/D) indicates that the bi-color drawing is based on increasing/decreasing values
For the record, the selection between a Rising/Falling or Positive/negative values approach for coloring histograms (and 2 color lines) was, in early I/RT versions, set by a global preferences setting (still visible in the File > Preferences > Chart > General menu). Still, this setting is no longer useful for Custom Indicators, as separate drawing styles have been created.
Line Drawing Styles
-
Line, Continuous
-
Line, Two Color (+/-)
-
Line, Two Color (U/D)
-
Line, Connected
-
Line, Stepped
The 2 "Line, Two Color" styles have the same properties & settings as the mono color "Line, continuous" style (other than offering a bi-color style)
Line Connected is strictly similar to Line, Continuous, except that it includes "dots" at the end of each line segment. Please note that the size and color shades of these dots are automatically derived from the width and color settings of the line itself.
"Line, Stepped" consists only of vertical and horizontal lines. The small horizontal line across each bar represents the indicator's value on that bar, and the small vertical lines connecting these horizontal lines represent the difference between each bar's value (change). Stepped Lines have two colors, one color for the horizontal lines, and a second color for the vertical lines. This style makes it easier to visualize the change from bar to bar of an indicator's value by observing the height and direction of each vertical line. Stepped lines also make it easier to pinpoint the indicator's exact price level, as each price level is marked by a more pronounced horizontal line segment.
Histogram Drawing Styles
-
Histogram, Solid (+/-)
-
Histogram, Hollow (+/-)
-
Histogram, Custom (+/-)
-
Histogram, Solid (U/D)
-
Histogram, Hollow (U/D)
-
Histogram, Custom (U/D)
For solid and hollow histogram styles, the width is automatically adjusted to fit the available pixel/bar space (there is therefore no width input)
For the histogram and custom styles, the width is determined by a custom width input selected via the corresponding Colour/Style menus. By default, there is no monocolor histogram style (if needed, use one of the bi-color style and select the same color for both settings)
Steps Drawing Styles
These 2 options are very similar to the Line, Stepped" drawing style, except Steps does not draw the vertical lines connecting the Steps, just the horizontal ledges. Steps draws all horizontal lines the same color, while Steps (U/D) draws increasing values in the up color (first color) and decreasing values in the down.
"Price Box" Drawing Styles
-
Price Box, Solid
-
Price Box, Hollow
-
Price Box, Solid (U/D)
-
Price Box, Hollow (U/D)
These "Price Box" drawing styles are intended for indicators, such as Moving Average, VWAP, or Session Statistics, that generate results aligned with the "price" of the underlying instrument and plot on the same scale as the instrument.
These options draw a solid (resp. hollow) box behind (resp. around) the indicator's price on each bar. The width of the price box is equal to the width of each bar (pixels per bar), and the height of the box represents the height of one price or tick for the underlying instrument.
Please note that the Solid options is typically displayed as background, i.e., the Custom indicator is located at the bottom of the chart element manager list, while hollow options can be placed at any layer position within the list of elements
"Invisible" Drawing Style
This option may be useful on many occasions; For example,
-
you want only to be able to review the indicator value through the Pane title or through an Infobox,
-
You need to have the custom indicator present on the chart so that another indicator can access the CI value, such as a Reference Line, Infobox, a Signal marker, a Footprint bar statistics, etc
Or you want to use the "Store current value into a V#" feature, but don't need to display the historical values of the corresponding CI.
3) The "Color and style" selection box
This box typically opens a menu with the following items
Not every menu item appears upon the selection of a particular drawing style. For example: a Histogram (solid) or Price Box (solid) drawing style only have color selection boxes, but no Width or Bands options (which are most useful for Line or Steps drawing style), etc
Concerning the Style choice itself, please note that
-
Solid is the default setting and the most commonly used line style
-
Dots are typically used together with the Line Continuous or Two Color options. This way, the CI display is only made of (non-connected) dots whose size is controlled by the width settings as discussed in this forum topic
-
Dashed can only be displayed in the case of lines having a width of 1 pixel
Finally, also designed for line styles, Bands offers multiple ways to add up to 3 sets of parallel lines above and/or below a given line, with their own sets of colors, line width and style, with the distance from the line being controlled either by several points, tick, percentage or an ATR(20) amount.
4) Other optional custom indicator preference settings
"Connect" options for handling the display of Zero values
There are three options for handling zero values when drawing the indicator.
-
"Connect All Values" means to draw the indicator line without any special consideration for zero values.
-
"Connect Non-Zero Values" results in drawing the indicator as if the zero values were not present at all, i.e. all non-zero values are connected by a line, the line being flat over periods of time when the indicator is zero.
-
"Connect Consecutive Non-Zero Values" calls for the custom indicator drawing to be suppressed during periods when the indicator is zero, i.e. only consecutive non-zero values are connected.
These 3 options are, of course, most useful with one of the Line drawing styles.
The third option was designed to display a custom indicator line only when a certain signal or condition was true. Consider, for example, the custom indicator MA * (CL >= MA), where MA is some moving average. This indicator is zero when the bar close is below the moving average; otherwise, it is simply the MA itself. If you put this custom indicator into a chart pane by itself using the new (third) drawing option, the line is only visible during periods that CL >= MA.
As detailed in this tutorial, by overlaying another Custom indicator, with a syntax such as MA * (CL < MA), a user could achieve a signal based bi-color display of an MA line (other than the one following a +/- or U/D logic)
Today, such a breakdown into 2 separate CIs is no longer needed thanks to the integrated "Paint When" features of the PaintIndicator RTX.
The Compute/Display Last X Values
This input box can manage two types of entries.
-
Either a single input, which is either ALL, or X
By default, the setting is set to ALL, which is the appropriate setting for 95%+ of the common CI formulas. On some occasions, a user might only want to compute and display the last X Bars and may introduce 1, 5 or 10 as an input for both compute/display settings
-
Either a dual input, such as ALL: ALL (or any X:Y combination of values)
This dual-input feature allows the user to specify separate lookback periods for both the evaluation and display tasks.
As discussed in this forum post, an ALL:ALL or ALL:100 setting is also required to update certain RTL formulas, such as those with tokens related to the Fractals or ZigZag Oscillator indicators, or those that use FREF-like functions ("forward looking" formula). Indeed, the computation of past bars (i.e., RTL tokens value) may be modified based on the value of future bars, as illustrated in this Zigzag Indicator Oscillator video.
First and Second reference line
These 2 reference lines are most useful when the Custom Indicator RTL formula produces an Oscillator-type output (such as an RSI or Stochastics token) or any RTL formula that returns values within a normalised range.
Optional preferences settings (that only appear upon the selection of some drawing style)
The following preferences appear just below the "Second reference line" checkbox.
-
For all 6 Histogram drawing styles: An "Oscillate about: X" checkbox offers the ability to have the histogram base line being shifted vertically and therefore to have the histogram bars oscillate around the X value instead of zero
-
For the Line Two Color (+/-): "Extreme Level (+/-): X" checkbox allows to modify the coloring (based by default around a positive/negative value rules), ie one color colors any extreme value (above X or below -X) while the other color is used for any line value within the -X to +X range
Set Current Value into Variable
You have the option to store the spot value of an RTL formula into a V# or C# variable.
-
If you select a User Variable (V#), then you can use (and) display the corresponding last CI value in any Investor/RT objects, either through a %V#1 annotation in a chart, as an input of a reference line, through a column or Custom Column in a QuotePage, etc
-
If you select a Chart Variable (C#), then you can only display within the Chart range (for example, create an annotation with %C#1), but you can't recover the C#1 value in any other I/RT object
Please note that the frequency of the update is linked ot the 'Recalculate Every' settings (as located at the bottom of the Custom Indicator). Regarding the V# variable, make sure you have set up the variable format and name in the File > Preferences > User Variables window.
Label and format features
The label checkbox includes 4 possible location options: Above, Below, Inside, Outside. The Label is displayed horizontally, except when the Vertical box is checked
The format checkbox controls the output display format, both
-
For the label display next to the CI (when the "Label" box is checked)
-
But also, when the label box is not checked, for the format of the custom indicator's numerical values being displayed on the chart pane titles, info boxes, etc. The
One of the display format choices is "Instrument", which means the indicator's value is displayed using the display format of the associated instrument (ticker symbol) used to calculate it. This is the preferred choice whenever the CI formula returns a price-related result.
Extend Naked Value
This menu only appears when a Line drawing style is selected. It is often recommended to use it together with the Style set to dots, as the goal of this feature is often to display extended naked lines, not the line connecting the different values of the CI itself.
Extend Naked Lines extends the price of the custom indicator on each bar with a horizontal line until the price of a future bar takes it out.
When "Extend Naked Lines" is turned on, the user specifies whether they would like the naked value of all bars extended, or only those of the visible bars. In addition, the user may specify how many bars the value must remain naked before it is drawn and extended. The "Extend Naked Values" feature works best for prices that stay within the bar's high-low range, such as High, Low, H+L/2, POC, VAH, etc. This feature makes it very easy to see when the price returns to a key price from a previous bar.
Please review the dedicated CustomNakedLevels RTX indicator for additional naked lines type of features (it offers, among others, the ability to access the nearest naked line value through an RTL token)
Shift Right/Left by X bars Option.
The Shift option allows the user to shift the custom indicator values by any number of bars in either direction. When shifting the custom indicator to the right, the values are drawn into the future past the right-most bar. Shifting has always been a feature of the Moving Average indicator, and it is now available to all RTL formulas by enabling it in Custom Indicator.
Hide Line First (resp last) N Minutes of session.
Please note these features work for any drawing style (not only lines) and are typically used to restrict the display of a Custom Indicator (being applied to a chart session being set to the Full sessions) to one of the subsessions of the full session, i.e., the Overnight session or the RTH sessions, for example. In this case, the user needs to compute the number of minutes accordingly from the start or end of the sessions to achieve the desired display filter.
Store to User Array Upon OK
This is an advanced feature useful only to subscribers with very specific backtesting requirements. When a custom indicator is added to a chart, its results can now be stored in a User Array, which can then be used in backtesting and other areas of the product. As a specific example, if a user wants to use the developing VPOC of Profiles that are built from custom Boundaries, previously, there has been no way to access this data in backtesting. A user may now simply check the "Store to User Array Upon OK" checkbox and supply a name for the User Array, such as VPOC. When the user hits OK, all data in the user array is deleted and replaced with the custom indicator data in the chart. If the symbol is @ES# and the user array name is VPOC, the resulting symbol generated will be ES#_VPOC and will be accessible in RTL using either the ARRAY token or better yet using the MPD token and specifying "Mix Ticker: @ES#_VPOC"