The Spiral indicator (also know as the "Logarithmic Spiral") provides a link between price and time analysis, and can help in forecasting both price and time. Similar to indicators such as Fibonacci Retracements, Fibonacci Arcs, and Gann Angles, the Spirals indicators is based off a trendline which connects a significant high with a significant low. The spiral can be drawn in a clockwise and/or counter-clockwise direction originating from the endpoint of the trendline. To add the Spiral indicator to a chart, use the new Spirals button  on the charting toolbar. After clicking the spiral button
  , mouse down in the chart and drag a trendline connect any two bars between which you'd like trendline drawn. The spiral will then be automatically drawn off the resulting trendline.
Presentation

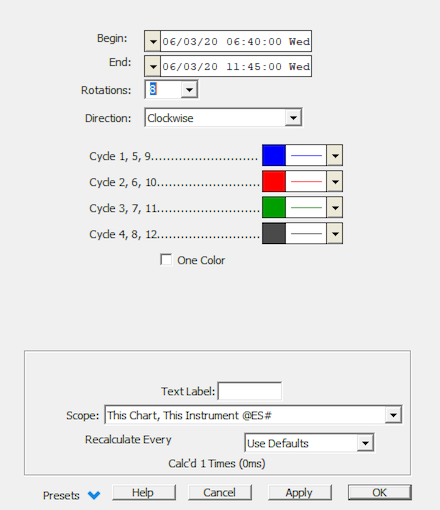
Above is a Daily Chart of Intel (INTC). The diagonal blue line represents a trendline between two extreme prices, based on the begin and end date-times specified in the preferences below. In this example, the spirals are drawn in a clockwise direction from the endpoint of the trendline.
Keyboard Adjustment
The keyboard can be used to move the Spiral trendline endpoints to the right and left. First, click on the chart. Then hit the tab key repeatedly until you notice your Spiral is selected. Then, press the right or left arrow keys on your keyboard to move the entire trendline right or left one bar. To move the trendline up or down, press the up and down arrows on the keyboard. If you would like to move only the endpoint, then hold down the Ctrl key while pressing the right or left arrow keys. If you would like to move only the beginning point, then hold down the Shift key while pressing the right or left arrow keys. You can also quickly increase or decrease the line thickness of the spiral lines with a ctrl-up arrow or ctrl-down arrow.


