TPO Indicator requires the Profile Package.
The TPO Indicator computes and displays historical values for TPO Profile price levels: POC, Value Area High (VAH), Value Area Low (VAH), developing POC, VAH, and VAL. It enables review these values historically to see see how price reacted when approaching these levels. While developing POC, VAH, and VAL change throughout the day, traditional TPO Profile charts only show the current values. The TPO Indicator allows the user to look back and see where the levels were at any given historical time. TPO is an acronym for Time/Price Opportunity.
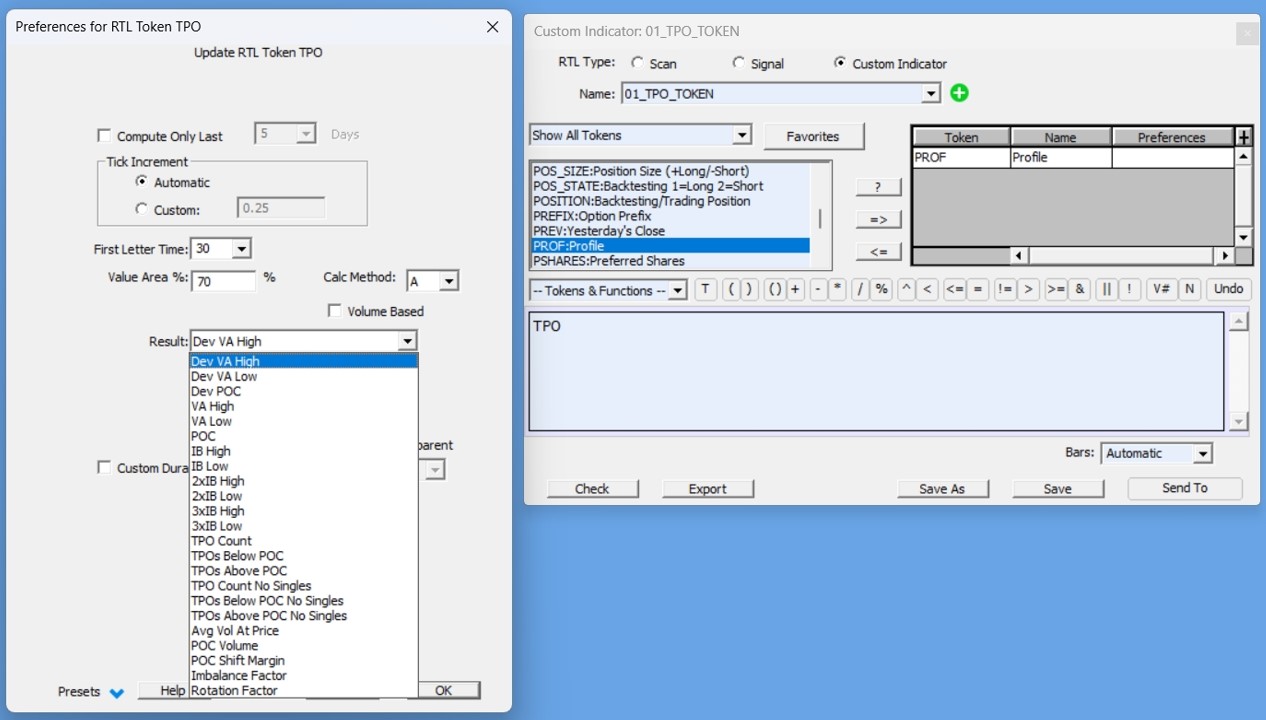
The RTL token for this indicator is TPO. When used in the language, in addition to the VA & POCs mentioned above, the TPO indicator provides the user access to IB High and Low, 2x and 3x IB Highs and Lows, TPO counts, TPO counts above and below the POC (both with and without singles). These are very powerful tools for users interested in backtesting TPO Profile related strategies, or charting MP related data on traditional charts. To look for price being within 0.50 of the developing VAH, use the RTL formula:
CL >= TPO - 0.50 AND CL <= TPO + 0.50
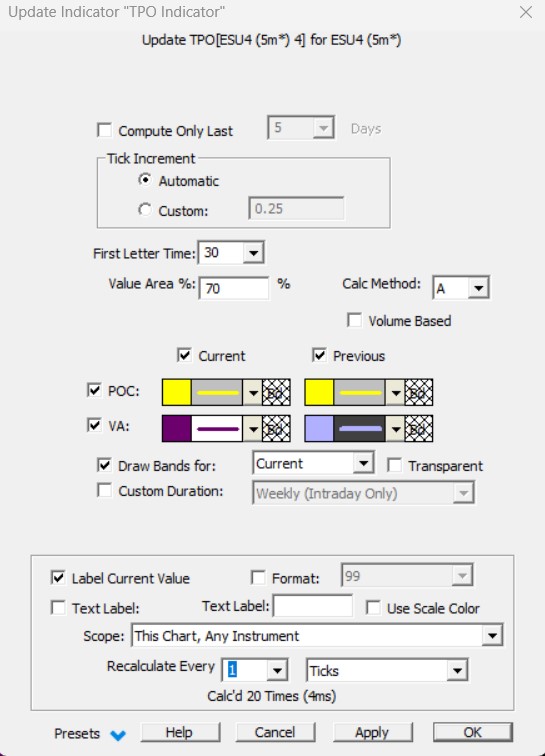
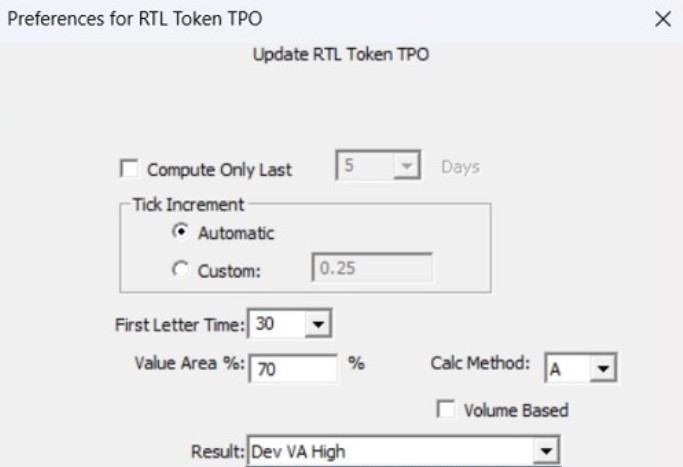
where the TPO indicator is set as follows:
Here are all the available output results for the TPO token
Presentation
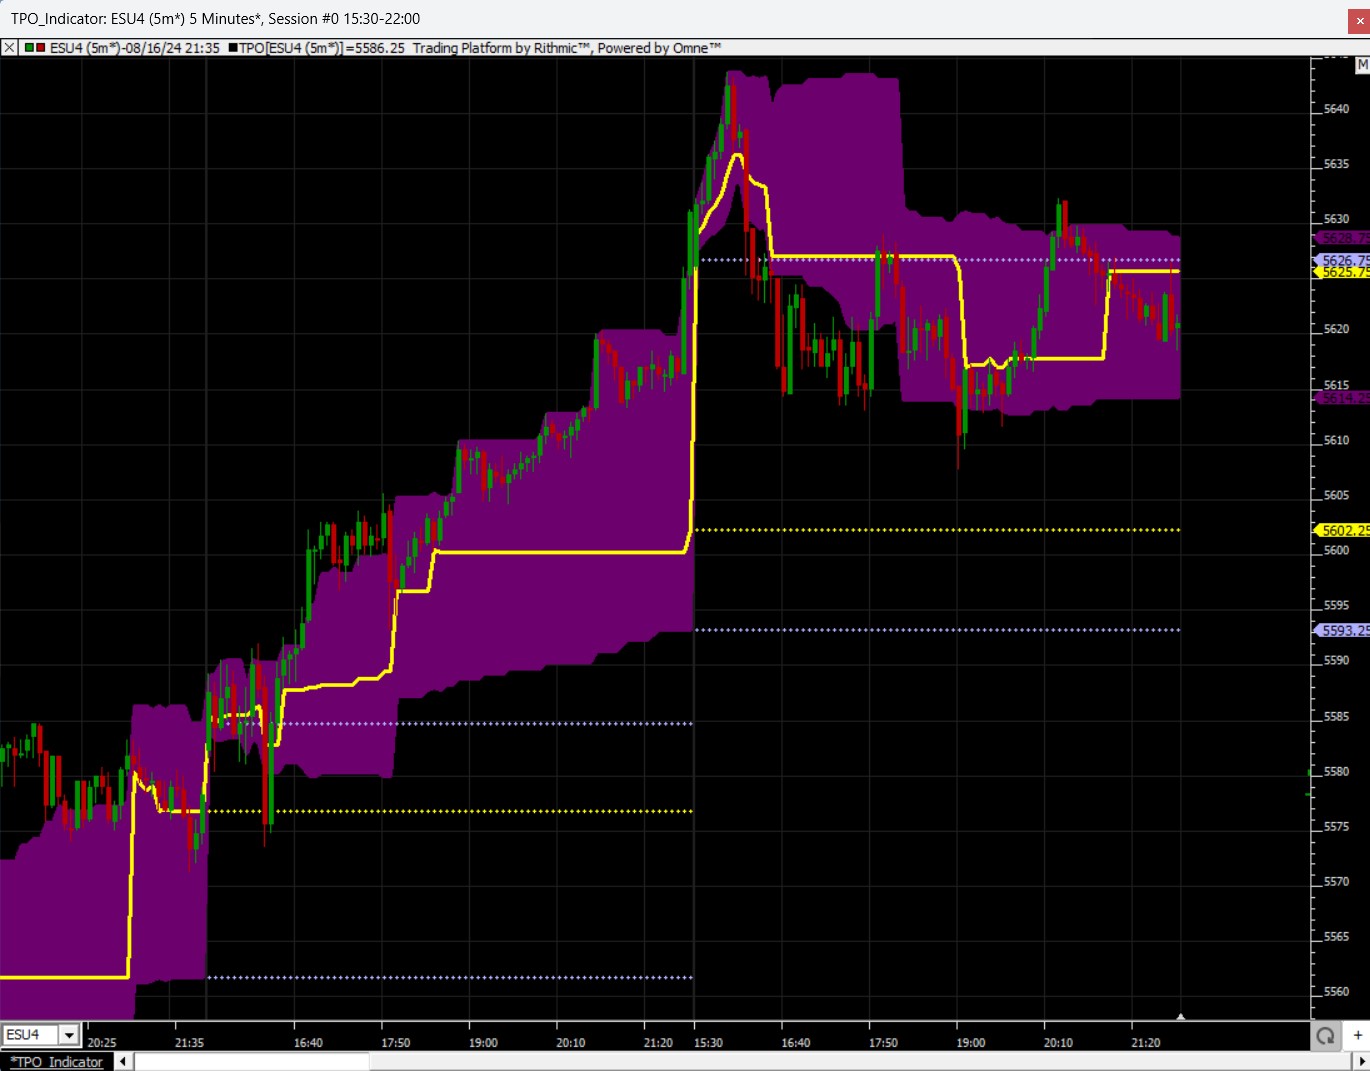
5 min ES chart - Day session with the TPO indicator : current developing POC and Value Area band together with previous session values displayed as dots (settings as highlighted in the preference tab)


