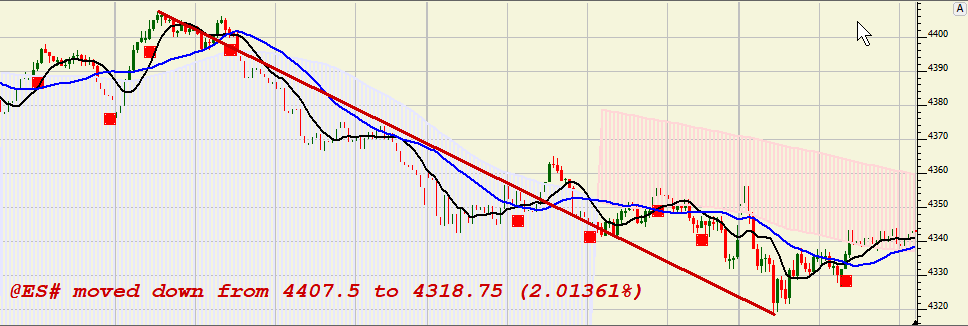
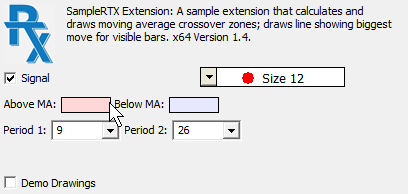
A sample RTX extension that draws a trendline showing the maximum price excursion within the visible portion of the chart. Zoom the chart in/out using mouse wheel and the trendline will redraw for the visible bars. Changing periodicity also affects the visible bars; the SampleRTX will adjust to new visible bars of the new periodicity. For those interested in RTX development, source code is provided for this RTX in the InvestorRT\rtx\lsSampleRTX directory. SampleRTX parameters include two moving averages and the drawing includes a marker to denote crossovers of the two moving average lines.
Presentation


