RTX

Buy Sell Meter Chart (RTX)

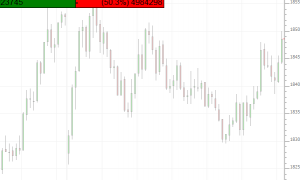
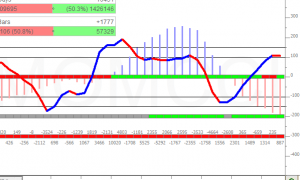
The BuySellMeter extension displays the buying volume versus the selling volume for a user-specified period of time expressed as a number of days or number of bars.  Buying volume is defined as volume that traded at the ask/offer price; selling volume is defined as volume traded at the bid price.  BuySellMeter provides a nice visual of these two volume metrics in a compact box that may be positioned anywhere in the chart. 

Day Types Chart (RTX)

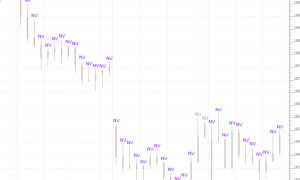
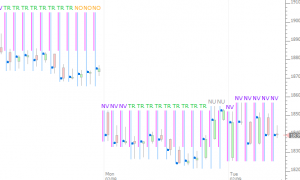
The DayTypes RTX Indicator determines the developing day type throughout the session and labels each bar with the day type in effect as of that bar.  The determination of day type is rooted in Market Profile methodology and is based on the relationship of the range of the initial balance (1st 60 minutes of trading) relative to the range of the full session and the relative location of the closing price.

Paint Indicator Chart (RTX)

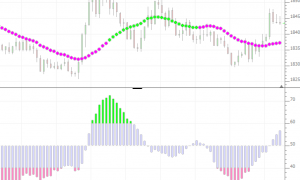
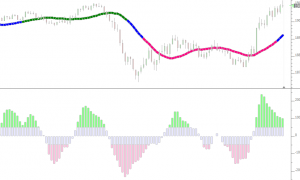
The Paint Indicator allows users to paint any indicator based on a variety of conditions and draw using unique drawing styles. Up to 4 painting conditions may be specified with each condition giving options to paint based on either an indicators value relative to a constant number, an indicators value relative to another indicator, or based on a signal being true.

DayTypes (RTX)

The DayTypes RTX Extension determines the developing day type throughout the session and labels each bar with the day type in effect as of that bar.  The determination of day type is rooted in Market Profile methodology and is based on the relationship of the range of the initial balance (1st 60 minutes of trading) relative to the range of the full session and the relative location of the closing price.  

Sine Wave (RTX)

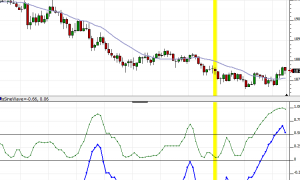
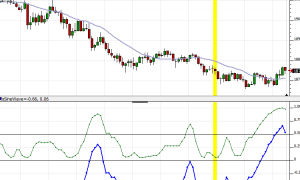
The SineWave RTX extension is the RTX implementation of the Ehlers Sine Wave indicator. See Cybernetic Analysis for Stocks and Futures by John Ehlers. Two forms of the indicator are supported, known as the CyberneticsAnalysis and RocketScience method, selectable as a user preference.

BuySellMeter (RTX)

The BuySellMeter extension displays the buying volume versus the selling volume for a user-specified period of time expressed as a number of days or number of bars.  Buying volume is defined as volume that traded at the ask/offer price; selling volume is defined as volume traded at the bid price.  BuySellMeter provides a nice visual of these two volume metrics in a compact box that may be positioned anywhere in the chart.  The horizontal and vertical position of the box (in pixels from top left) may be entered in the indicator preferences, or you can drag and drop the box using the mouse. The position can be fine tuned by clicking inside the box to select it and then using the keyboard arrow keys.

PaintIndicator (RTX)

The PaintIndicator RTX extension allows users to paint any indicator based on a variety of conditions and draw using some new and unique drawing styles. Up to 6 painting conditions may be specified with each condition giving options to paint based on an indicators value relative to a constant number, an indicators value relative to another indicator, or based on a signal being true. Any custom indicator can be used as the basis for the PaintIndicator. The PaintIndicator has it's own base color which will be used when none of the paint conditions apply.

ScatterPlot (RTX)

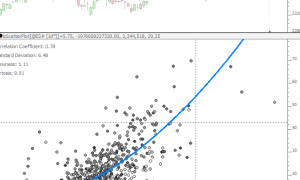
ScatterPlot takes two custom indicators and plots one on the horizontal (X Axis) and one on the vertical (Y Axis) and then computes a best fit polynomial regression line through the data of user-specified degree. Any two custom indicators may be used for the data set of this analysis. Each data point represents the values of the two custom indicators on any given bar. Each bar is drawn as a point/dot in the scatter plot. For example, the indicator can plot the daily volume versus the daily range in price.

Clear Chart (RTX)

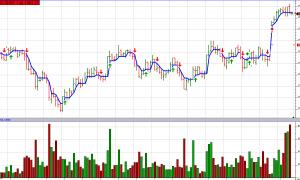
The Clear RTX Extension is an implementation of the Clear Method, a method for determining short term swing direction and produces a color coded output line showing the current swing direction and produces a signal on any bar when the direction reverses.

Pages