lsLookBackCandles (@ES#)
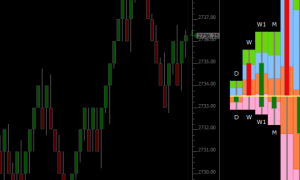
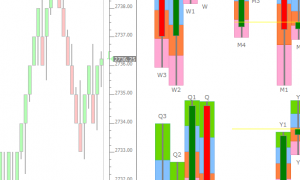
LookBackCandles. This chart was uploaded by Investor/RT 13.5.10 showing symbol: @ES#.
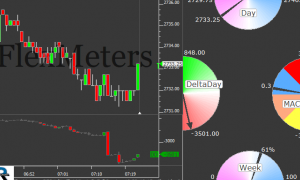
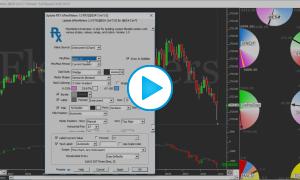
FlexMeters. This chart was uploaded by Investor/RT 13.5.9 showing symbol: @ES#. This chart is explained in the webinar Introducting Investor/RT version 13.5
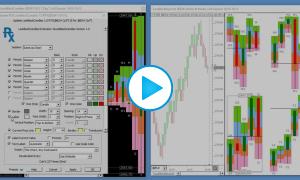
Add the LookBackCandles indicator to your chart to see at a glance how the current trading price relates to various lookback periods of trading: today, this week, this month, last few weeks, etc. Up to 8 lookback periods are shown in one compact display giving the trader both short and long term perspective on price action over various period of the recent past. LookBackCandles (LBC) can display daily, weekly, monthly, quarterly, and yearly candles; it can depict price action for any lookback period (such as 1 year back, 2 months back). LBC has an option to utilize its own scale to maximize the vertical space. Or it may share the same scale as the underlying data/instrument plotted in the chart. Up to 8 periods may be plotted with each instance of LBC and each may be given it's own colors and style or all lookback periods may share the same common colors and style. Each period may be labeled in order to make it clear what timeframe each bar/candle represents. A Current Price Line option makes it clear where the current price is in relation to each period, and a Paint Quadrants option allows the background of each of the quadrants of each bar to be drawn in a user-specified color. All prices computed by LBC may be store into a series of User Variables (V#) that are automatically labeled. LBC may be aligned to the left or right of the window pane, or dragged into the SideBar by simply dragging onto the scale at the right.
FlexMeters is an RTX extension designed to enable Investor/RT users to display customized meters of market behavior within multi-pane charts. This flexible tool draws meters showing the present value of some price or computed value as compared to a specified range of values seen in the past. FlexMeters can be drawn using a variety of shapes, colors, dials, positions, titles, and labelling options.
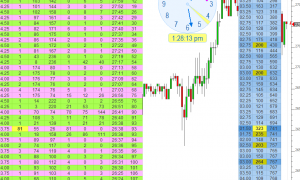
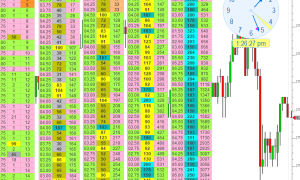
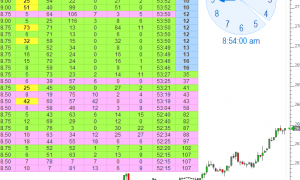
TimeAndSales - Multiple Filters. This chart was uploaded by Investor/RT 13.2.8 showing symbol: @ES#. This chart is explained in the video TimeAndSales MultiFilter
The RTX TimeAndSales extension (TAS) is used to embed time and sales displays into any Investor/RT chart window. TAS introduces a variety of new time and sales capabilities such as flexible filtering, highlighting and alerting options and much more. Display columns are user customizable. These include new data items of interest to traders: Skips, Bid Volume, Ask Volume, Age, Ticks Back and Consolidated Trades.
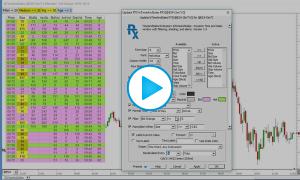
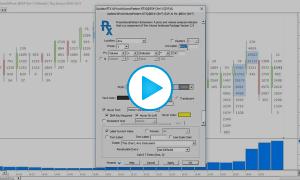
Ths video demonstrate how to identify large volume at price relative to the average volume at price of previous 9 bars. The Price Volume Pattern indicator compares the volume at price with a multiple of a custom indicator which in turn computes the average volume at price of previous 9 bars. A button at the top allows for dynamic manipulation of the multiplier. Use the link below to access and import the chart definition.
https://www.linnsoft.com/charts/bigvolumeatprice-es