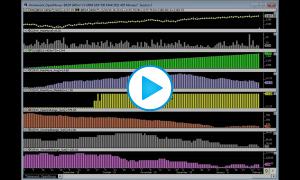
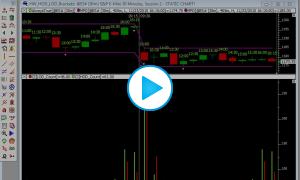
How often does price gap up or down on the ES? And when it does, how often is that gap closed.
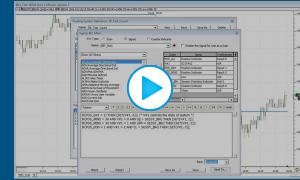
Gap Statistics Chart Definition Gap Statistics Plus Chart Definition (This chart also shows how many days the gap was recovered by 50%. It also requires the user to set C#2 to the number of days to lookback for gap. This number will most commonly be 1. If C#2 is set to 2, it will look for a gap from 2 days ago instead of previous day).
| Gap | Count | Percent | Number Closed | Closed Percent |
| 3 | 895 | 63.93% | 491 | 54.86% |
| 5 | 626 | 44.75% | 295 | 47.12% |
| 10 | 269 | 19.25% | 95 | 35.32% |
| 15 | 123 | 8.75% | 37 | 30.08% |
| 20 | 56 | 4.00% | 17 | 30.56% |
| 25 | 29 | 2.07% | 8 | 27.59% |
| 30 | 19 | 1.36% | 4 | 21.05% |
| 40 | 7 | 0.50% | 1 | 14.29% |
| 50 | 3 | 0.21% | 0 | 0.00% |
Note
Almost 1/3 of the time that price gaps 20 points in either direction, it closes that gap during the day session.
Over 45% of the time price gaps 3 points or more, it never closes that gap and never returns to the previous close.
The study was repeated to include an upper limit on the gaps, resulting in statistics based on gaps within certain ranges.
| Gap | Count | Percent | Number Closed | Closed Percent |
| 1-3 | 348 | 24.86% | 290 | 83.33% |
| 3-5 | 269 | 19.21% | 196 | 72.86% |
| 5-10 | 357 | 25.50% | 200 | 56.02% |
| 10-15 | 146 | 10.43% | 58 | 39.73% |
| 15-20 | 67 | 4.79% | 20 | 29.85% |
| 20-25 | 27 | 1.93% | 9 | 33.33% |
| 25-30 | 10 | 0.71% | 4 | 40.00% |
| 30-40 | 12 | 0.86% | 3 | 25.00% |
| 40-50 | 4 | 0.29% | 1 | 25.00% |
| 50+ | 1 | 0.07% | 0 | 0.00% |


