GOLDBTF (QGC#)
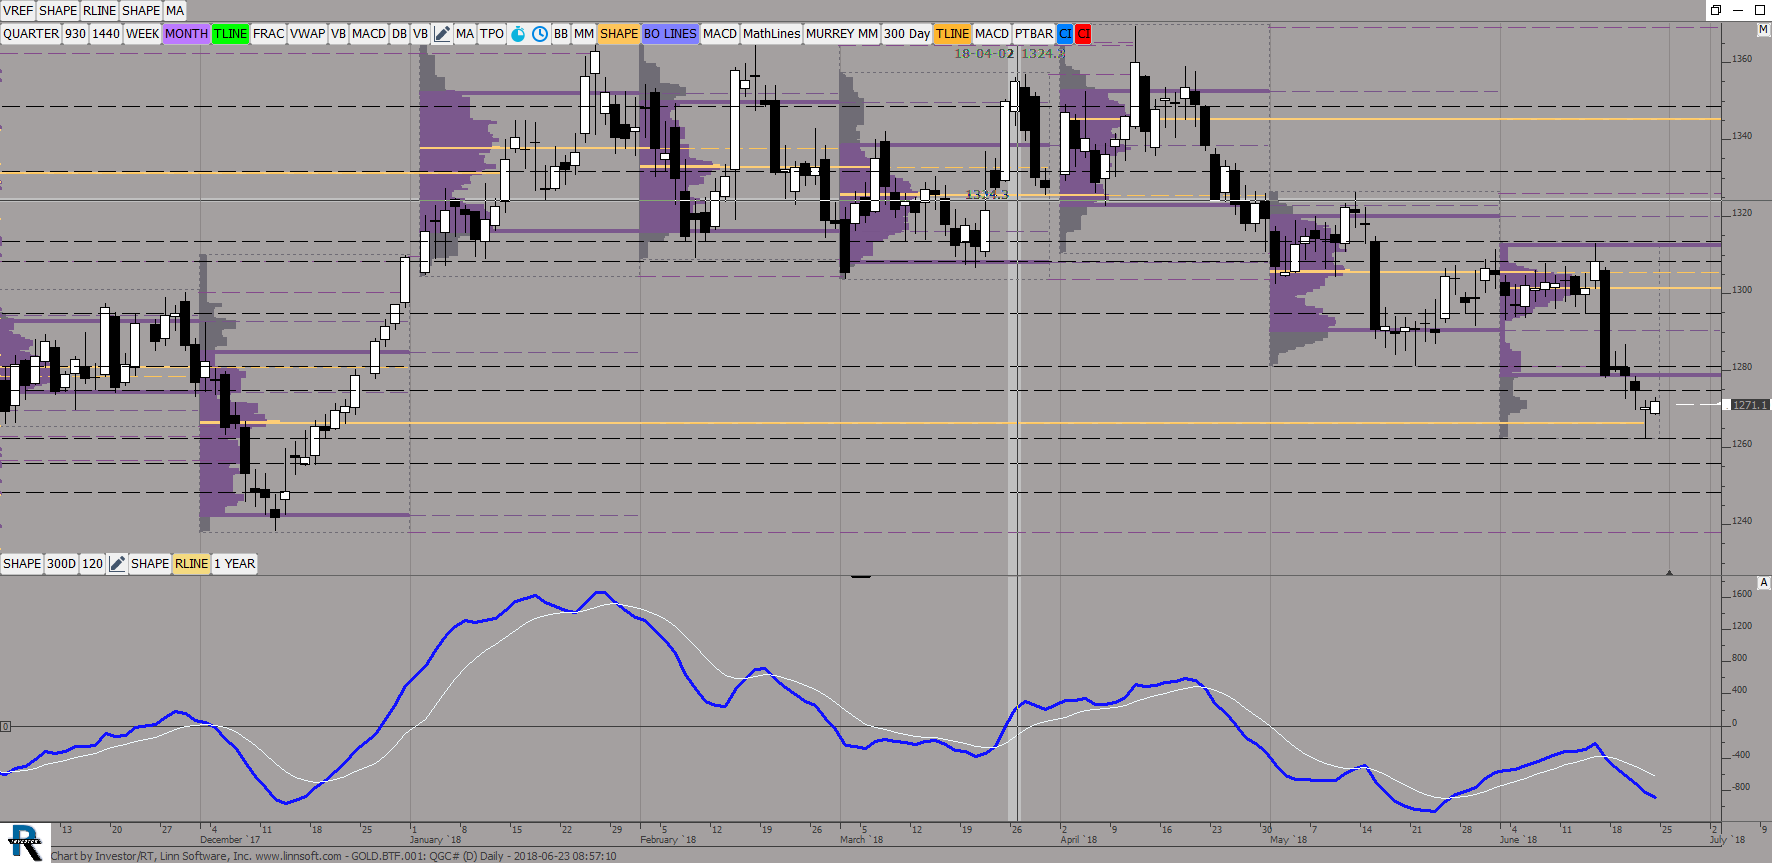
This chart was uploaded by Investor/RT 13.3.5 showing symbol: QGC#.
This chart was uploaded by Investor/RT 13.3.5 showing symbol: QGC#.
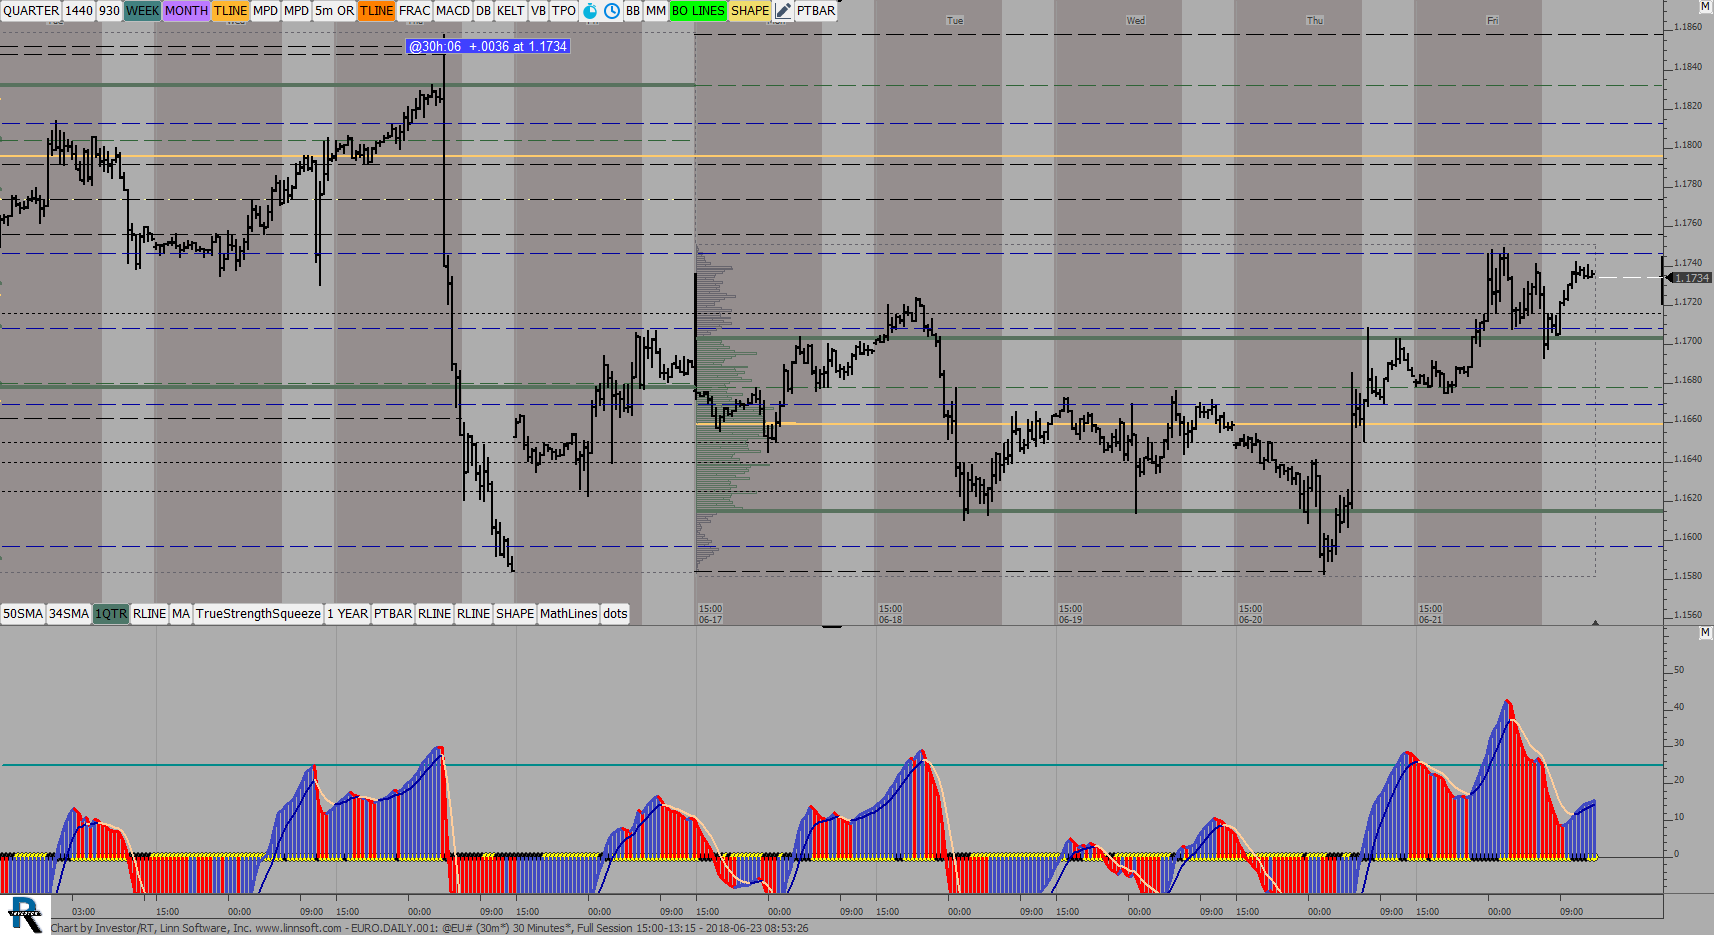
This chart was uploaded by Investor/RT 13.3.4 showing symbol: @EU#.
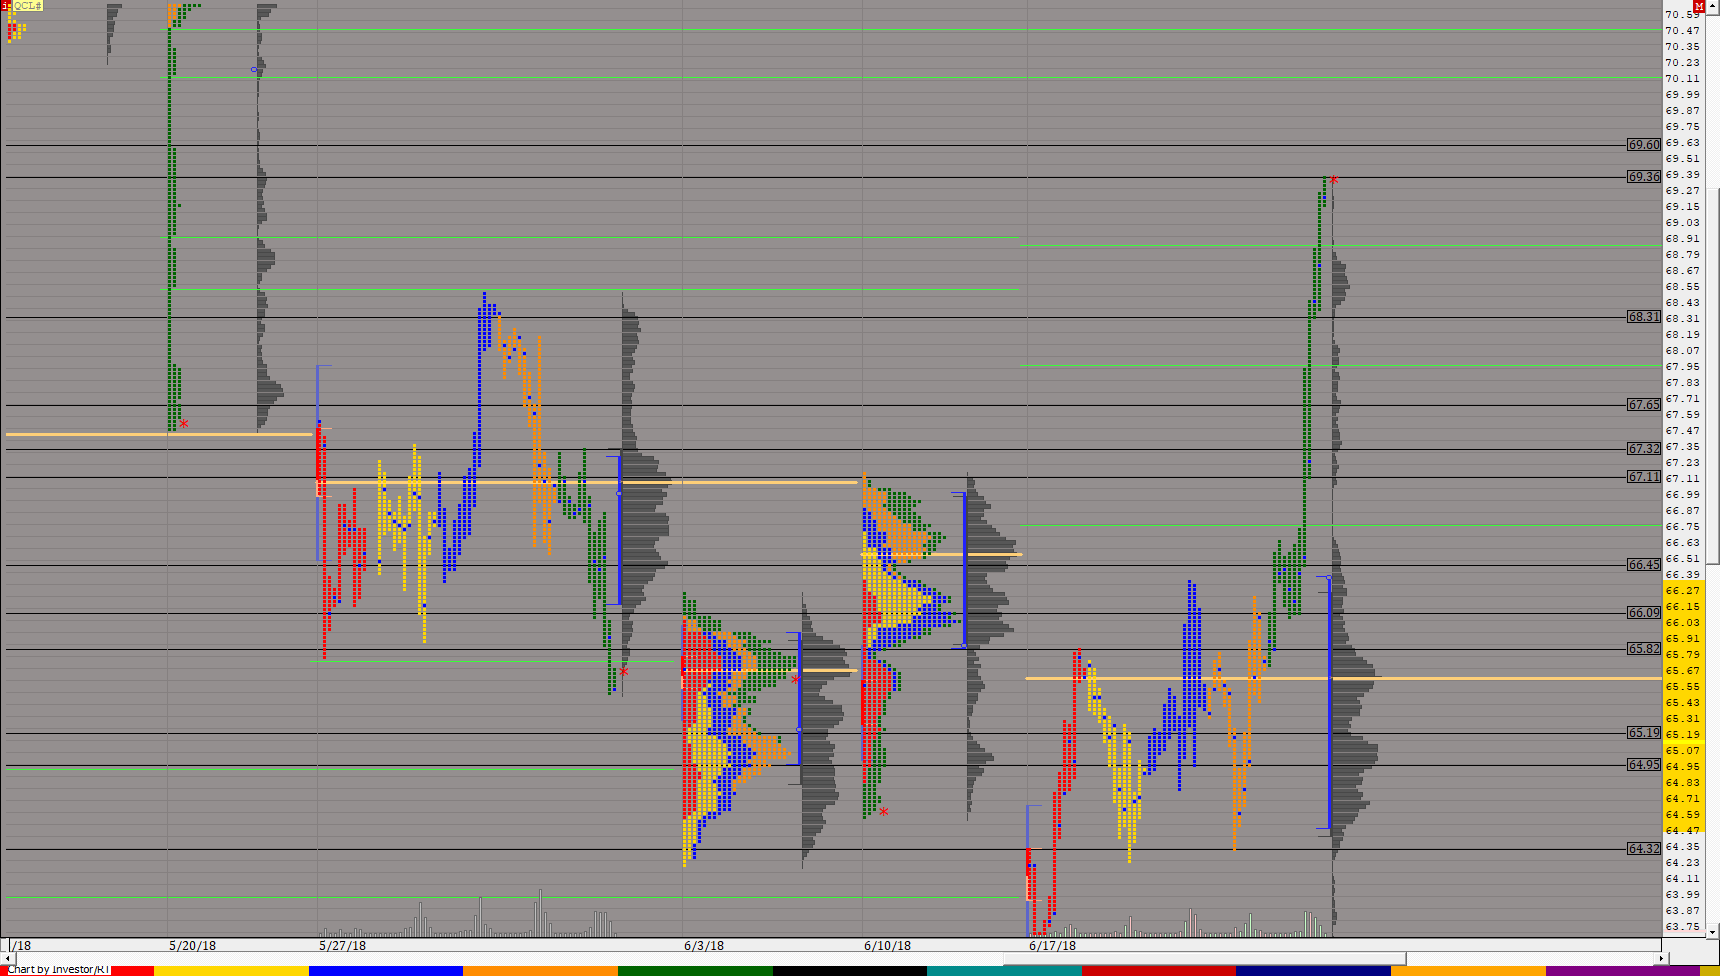
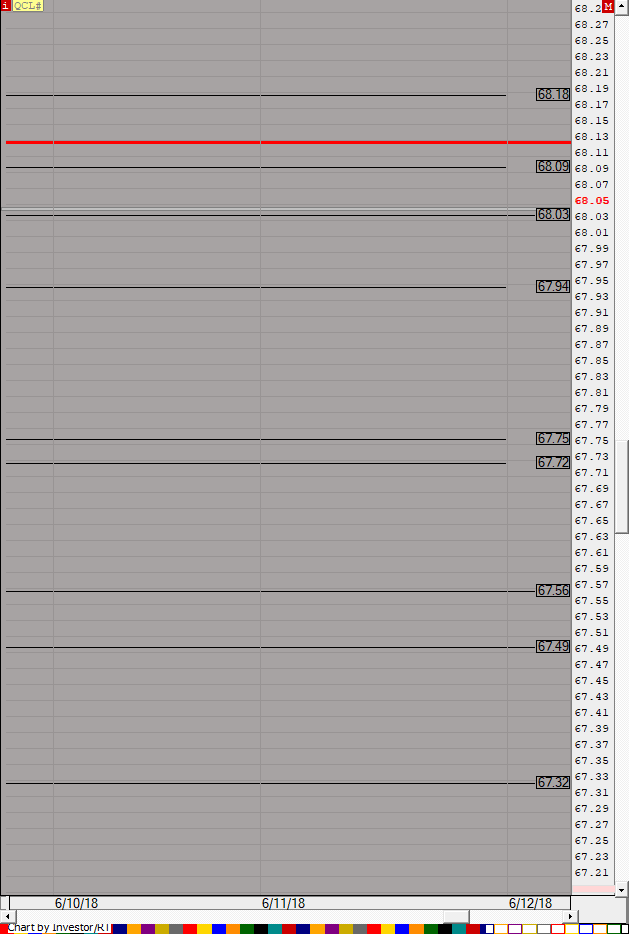
This chart was uploaded by Investor/RT 13.3.5 showing symbol: QCL#.
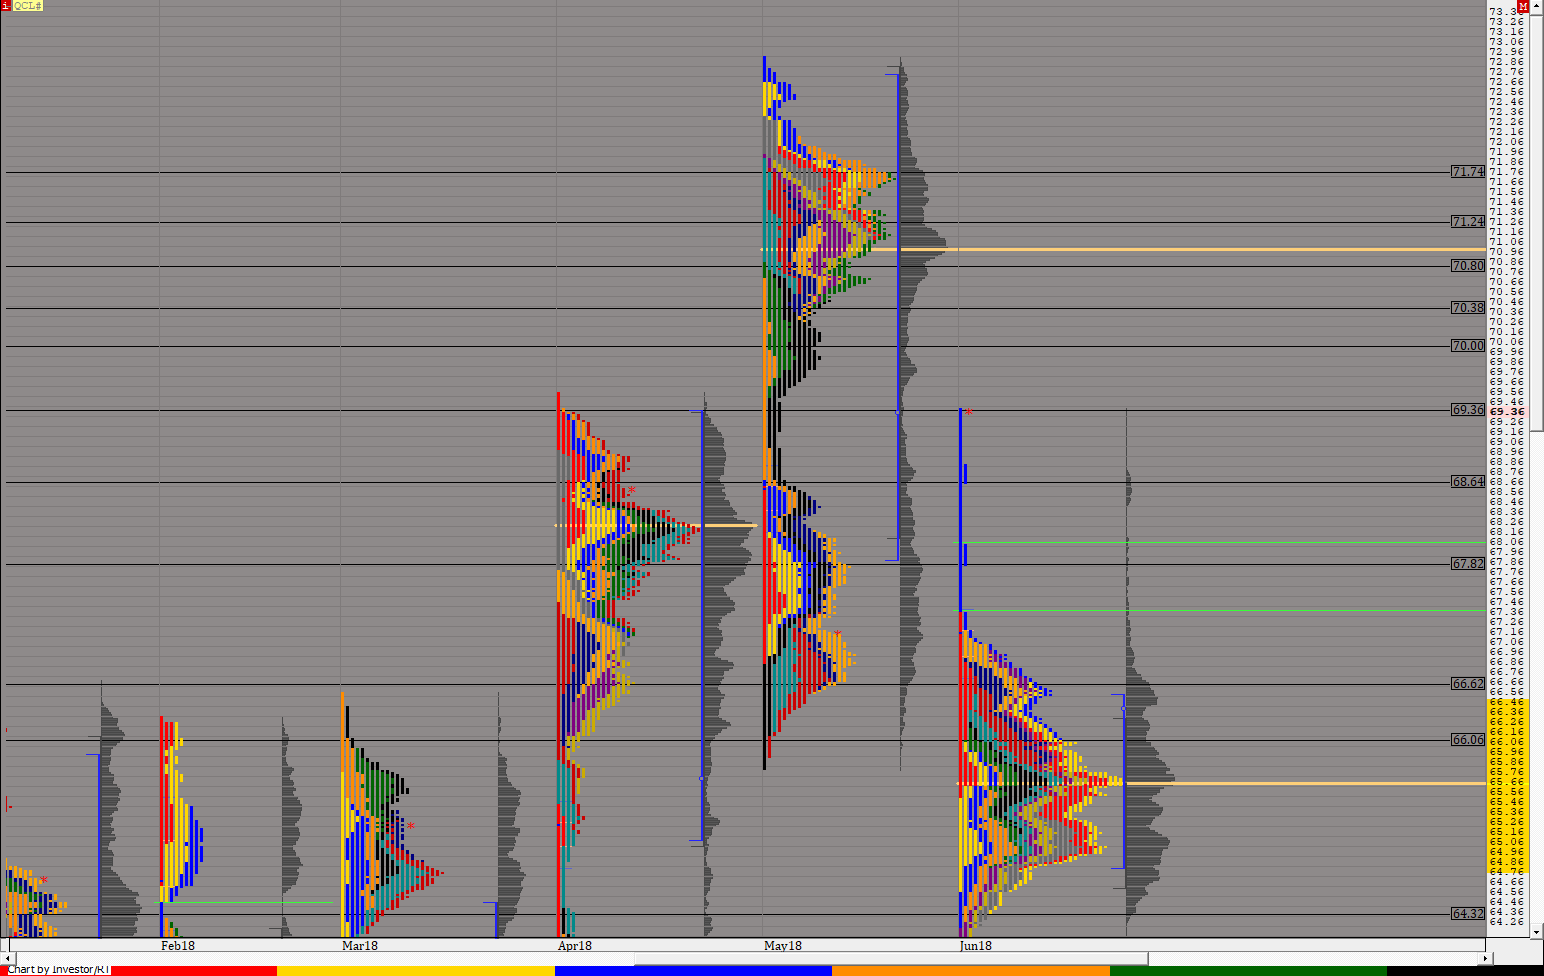
This chart was uploaded by Investor/RT 13.3.5 showing symbol: QCL#.
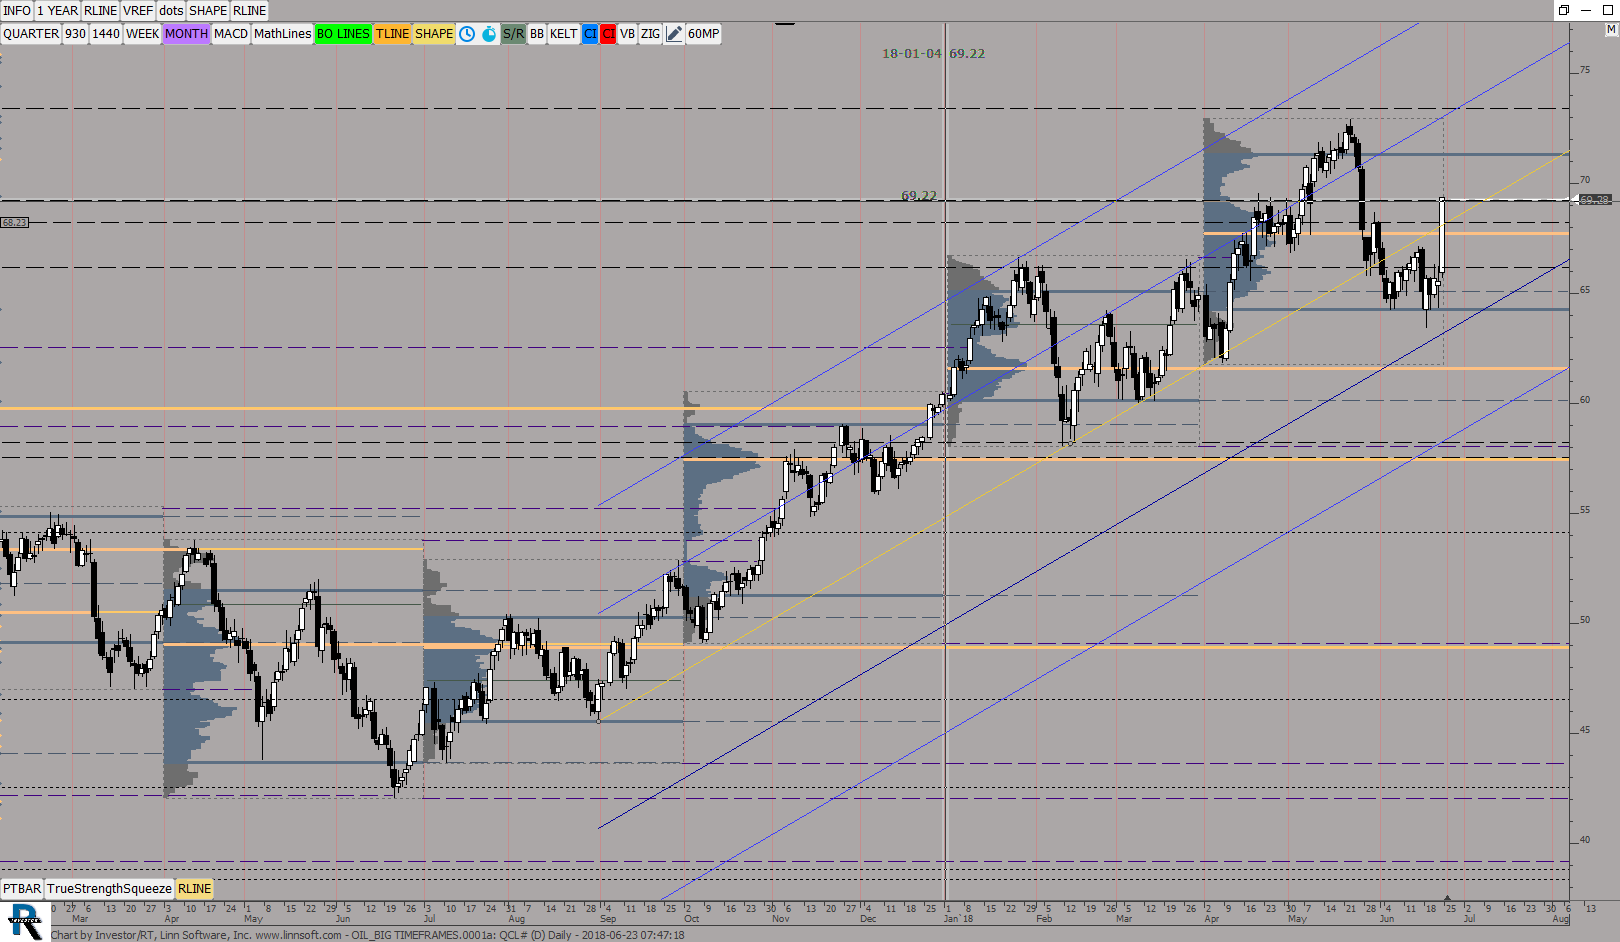
This chart was uploaded by Investor/RT 13.3.5 showing symbol: QCL#.
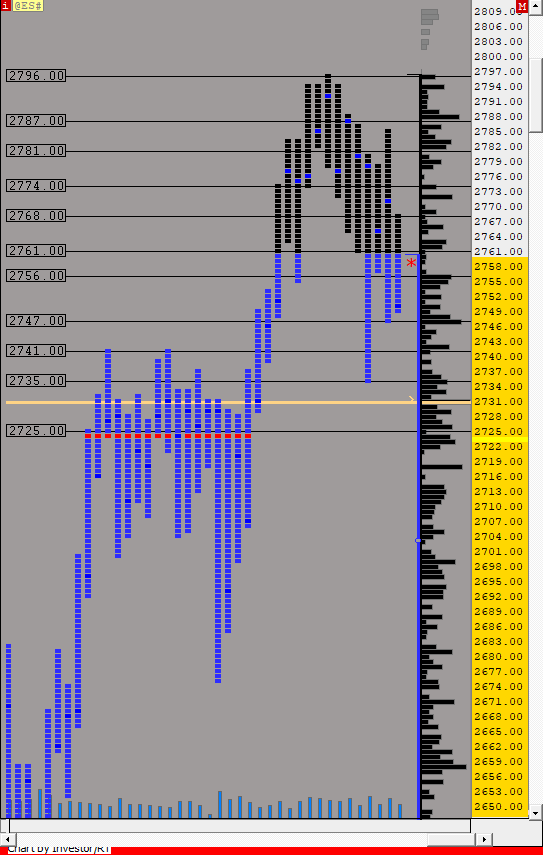
This chart was uploaded by Investor/RT 13.3.4 showing symbol: @ES#.
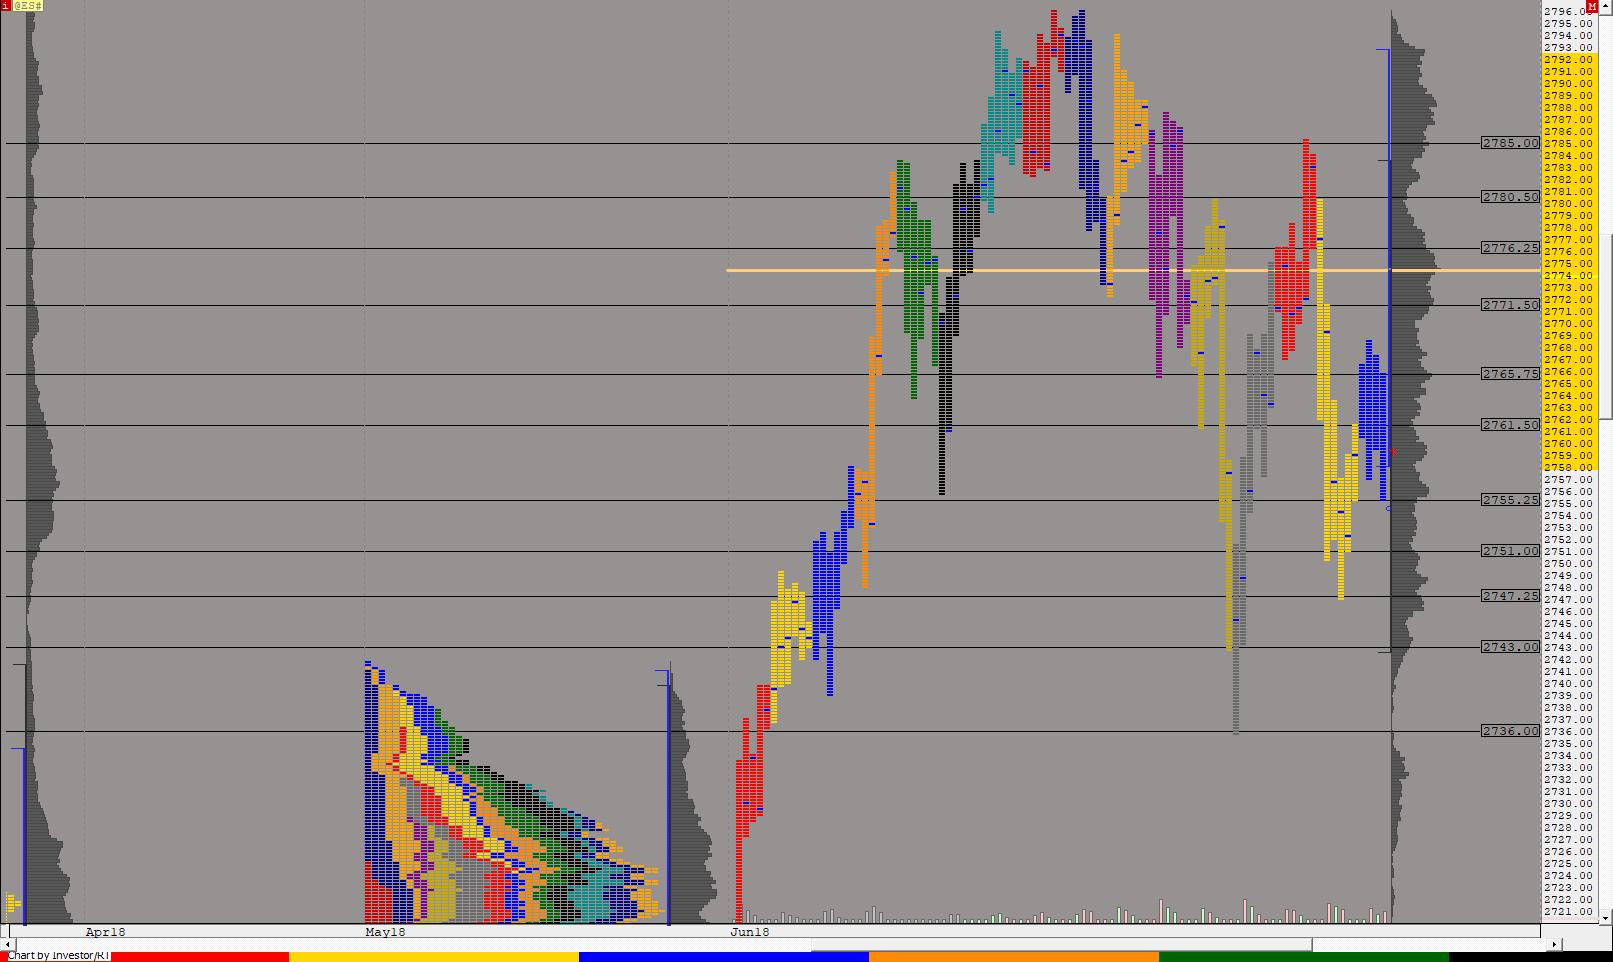
This chart was uploaded by Investor/RT 13.3.4 showing symbol: @ES#.
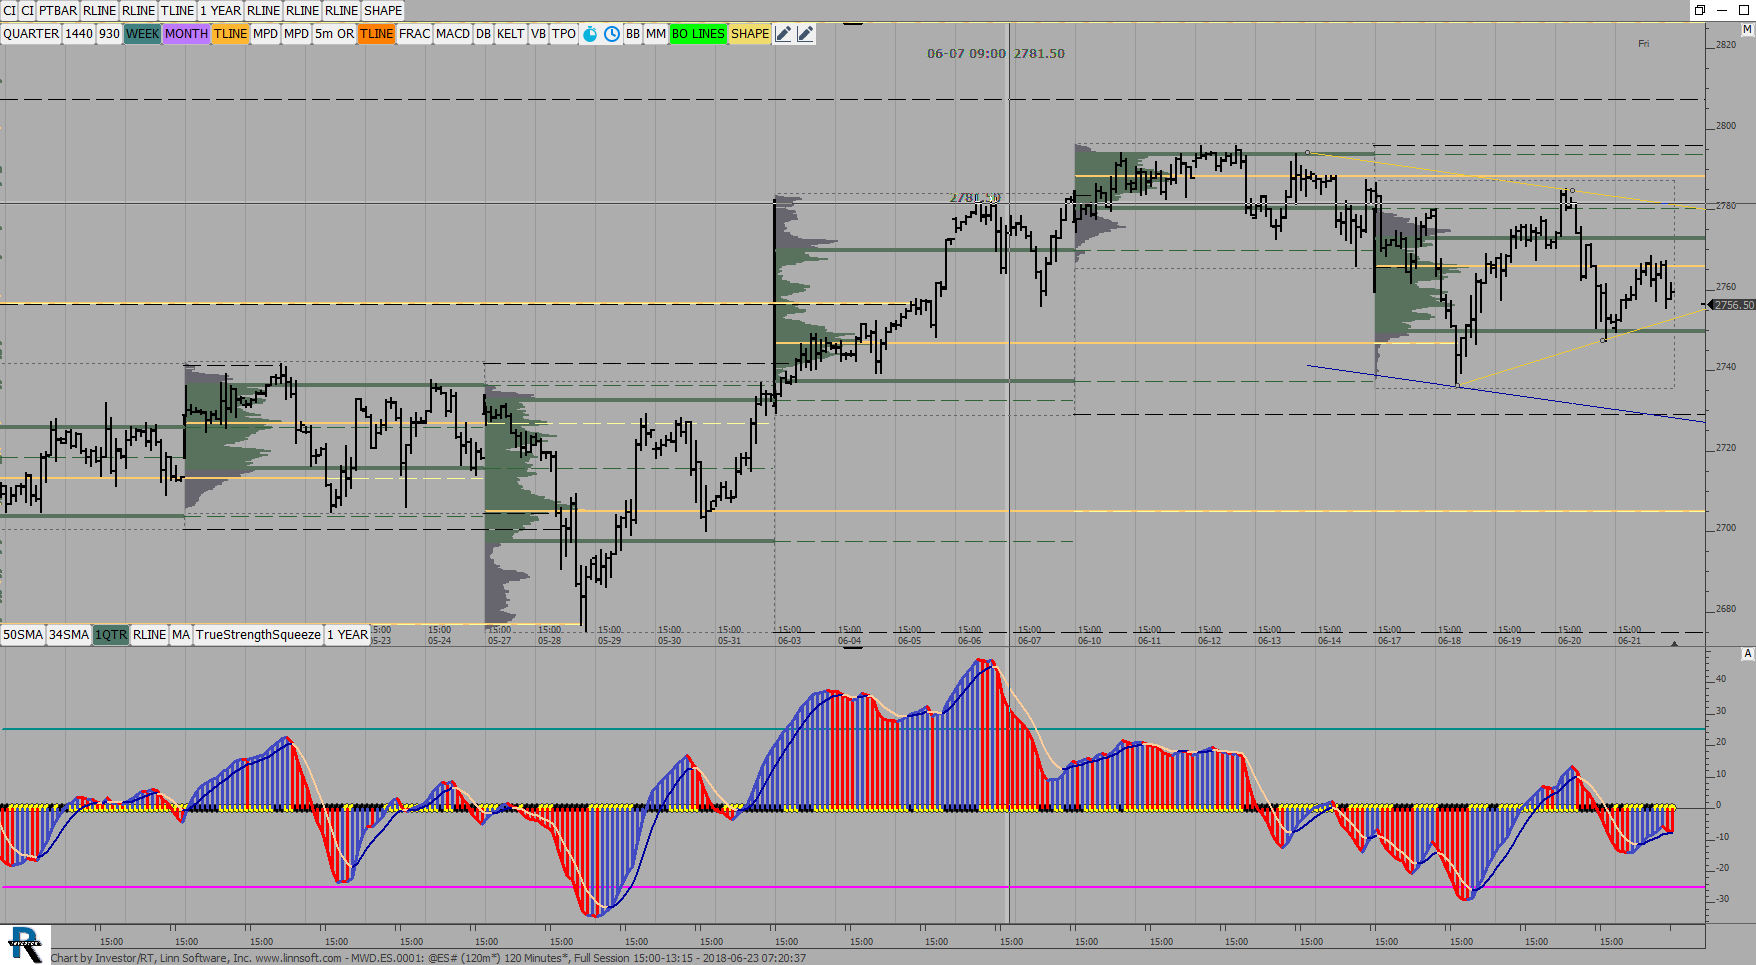
This chart was uploaded by Investor/RT 13.3.4 showing symbol: @ES#.
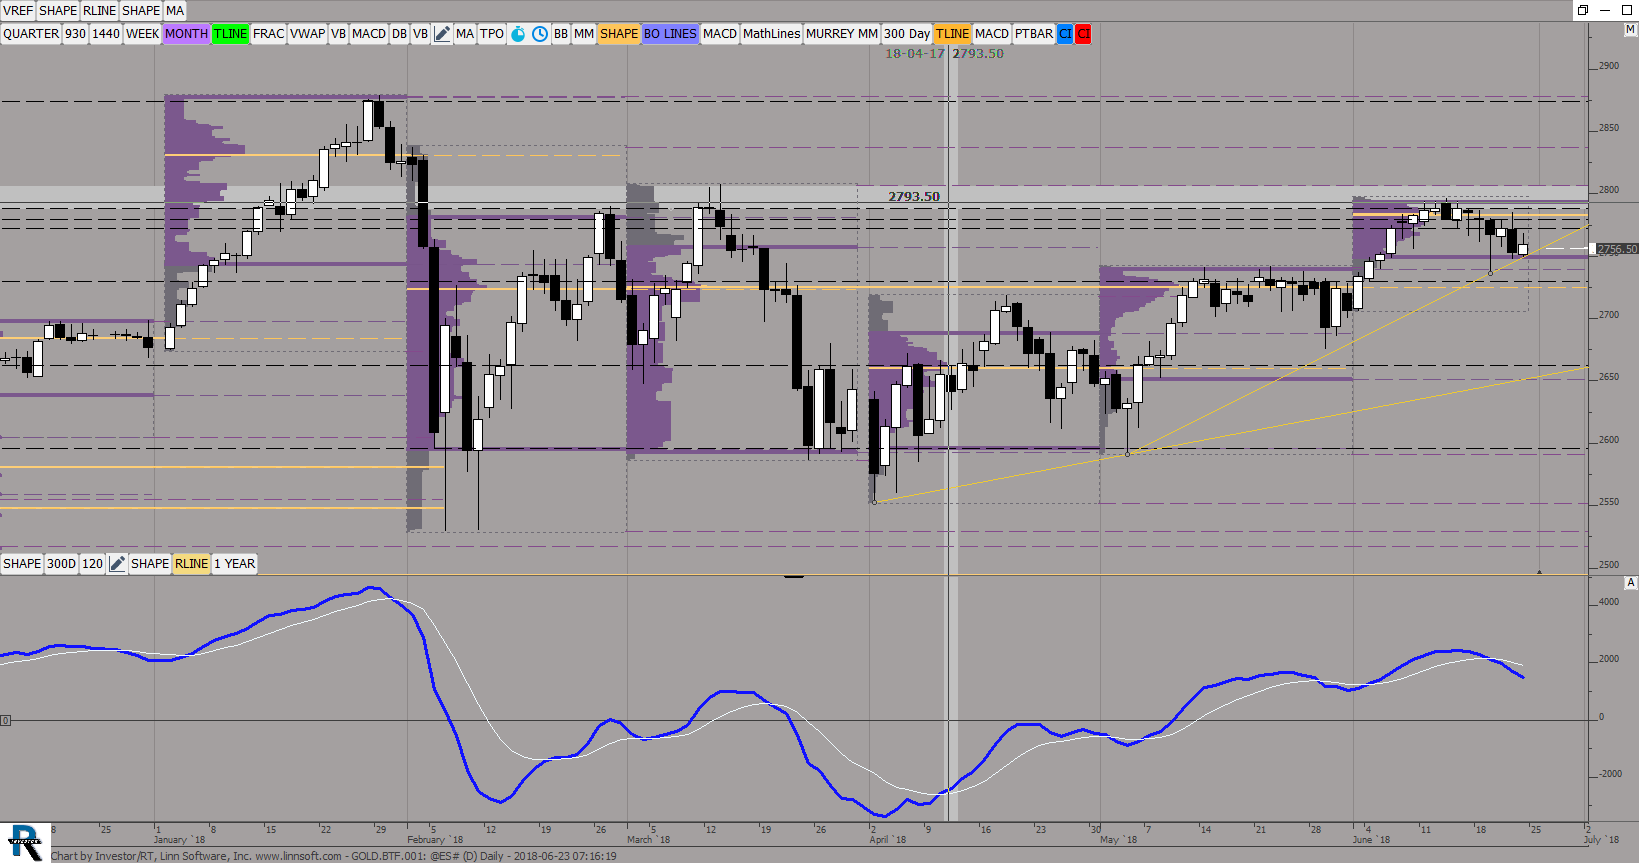
This chart was uploaded by Investor/RT 13.3.5 showing symbol: @ES#.
This chart was uploaded by Investor/RT 13.3.4 showing symbol: QCL#.