Right-click inside the message area of the main toolbar and access the Layout Toolbar submenu. You can choose to pin the toolbar to the right of the main toolbar, or bring the toolbar to the center of the screen. Once the layout toolar is visible, you may, of course, reposition it as desired by dragging it with the mouse.
Periodically, market data servers send Investor/RT a time of day notification to ensure that the user's computer clock is in sync with the server. When the time of day sent by the server, which we consider authoritative, is offset more than a second or two from the current time of day on your computer clock, this message will appear. It indicates a condition that should be corrected. It is important that your computer clock be set to the exact hour/minute/second every day.
A Group is simply a named collection of objects and (possibly) other groups, called subgroups. Objects are things you work with in Investor/RT, e.g. charts, quotepages, scans, signals, custom indicators, preset, etc. Groups give the Investor/RT user a facility for organizing collections of objects into named categories and subcategories. Instead of going through a list of 200 chart names looking for the one you want, you can setup one or more groups with appropriate names to hold shorter lists of charts.
Go to File > Preferences and select Configuration. Select the configuration variable you wish to revise and its default value will appear. Use the Override Value menu or enter a value for the configuration variable. Then click Apply or OK. The change goes into effect immediately.
Much of the documentation for Investor/RT is written from the perspective of the Windows version of the software. There is frequent mention of the Alt key, the Ctrl Key and the Delete Key. These are keys typically visible on Windows PC keyboards. On Macintosh PC's the keys are labeled differently (Think Different, as the Apple slogan goes).
The Alt Key is called the Command key on Macintosh keyboards. The symbol on the key typically resembles a cloverleaf. Long time users of Macintosh PCs will remember the days when this key was called the Apple key.
This be done with the Session Statistic Indicator
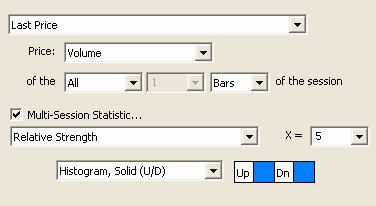
As an example, if you setup Session Statistics like the below:

Painting the Overnight Session Background
Yes, here is a video explaining just that.
To view as text, select the Profile Indicator by clicking on the containing rectangle (of the right-most profile). If you don't see the volume at price data when selected, you'll need to zoom in vertically using the shift-scroll wheel. When zoomed to a level where there is space for the text, the text should appear.
To export the volume at price data, right click on the containing rectangle of the profile and choose "Export Data".