This be done with the Session Statistic Indicator
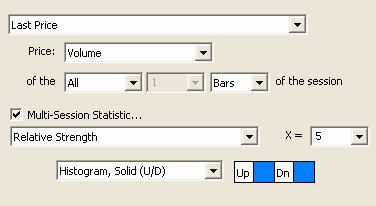
As an example, if you setup Session Statistics like the below:

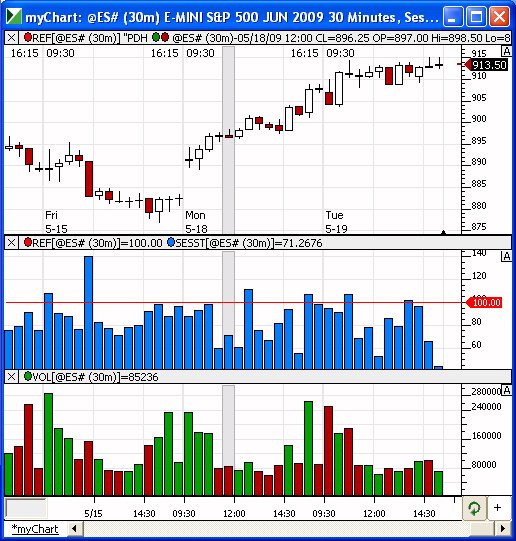
The result will be something similar to what you see below, with the blue histogram showing the "relative strength" of the volume as a percent of the average volume for the same bar/time over the past 5 days/session. A value of 120 means the volume of that bar was 20% greater than the average volume of same bar (30-min bar in this case) over the previous 5 days. You must have at least 6 days of data loaded in the view period of the chart in order for Session Statistics to compute properly under this setup.

To compute the average volume of bars at time, simply use the same settings as above, but change "relative strength" to "average "Avg of Bars at Time".
See Also
- Session Statistics Indicator This video offers a more thorough understanding of how it works.

