Creating Opening or Saving TPO Charts
- Create a New Chart: Go to File > New > Chart. Then choose the TPO Profile Chart as the Chart Style and choose a symbol and press OK.
- Open an Existing Chart: Go to File > Open > Chart. This opens the Object Manager set to Charts as the Object Type. You can than view all of your saved charts in the Object Manager. Select one or multiple to Open.
- Save a Chart: Right click the chart and choose Save or Save As and give this chart a name.
- Duplicate a Chart: Access the Right click menu of the chart, select Duplicate and give this chart a name.
The TPO chart feature vs the Profile indicator in a Multi-Pane chart
Market Profile charts were developed in the late 1980s by Peter Steidlmayer at the Chicago Board of Trade. Also known, under their generic name as TPO Profile charts (Time & Price Opportunities), they are available within Investor/RT under 2 means:
This support topic focuses entirely on the TPO Profile chart type, as initially implemented in Investor/RT 20 years ago. This specific chart type follows the strict rules and conventions of a traditional "Market Profile" and provides a huge amount of detailed information on both individual TPO letters and brackets in a dedicated Infobox. For a quick introduction on I/RT's dedicated TPO Profile chart features, please review first the Interface 101 and Chart settings tabs of this support page.
On the other hand, please note that many of the visual aspects of Market Profile charts can be reproduced in an Investor/RT standard multipane chart , having a 30 minute periodicity, by adding the generic Profile Indicator in a “Price and time” configuration Click here to learn more.
Import or Export Chart Definitions
Here are two ways to Import a Chart Definition:
- Go to File > Open Definition and Browse to the location of the saved Chart Definition and open it.
- Copy the contents of the Chart Definition text file to your Clipboard and then go to File > Open > Definition.
Here is how to Export a Chart Definition:
- Right click the Chart and choose Save > Definition. A window will appear so that you select the directory holding the chart definition file.
Mark the Open of each period with an "O"
The letter O is reserved for the first TPO/print of each bracket (letter period).The letter O will be printed if :
- It is the first TPO/print of the first bracket of the profile.
- It is the first TPO/print of any bracket of the profile if...
- the brackets/letters are split into separate columns
- the brackets are not split but the "letter color" is such that brackets can be distinguished by color. Such letter colors include Market Day, Rainbow, and Custom.
The logic behind this behavior stems from the fact that the opening letter O is only useful if the user is able to visually distinguish which bracket that O belongs to. When all the letters are the same color, and the profile is not split into separate columns, users are unable to identify which bracket each O belongs to, thus actual letter that corresponds to that bracket is printed instead. When brackets are split, or when brackets are painted with different colors, it's clear which bracket each TPO belongs to by the color or position, so an O can be printed for the opening print without any loss of information.
If a user would like to see the O's but is not using a letter color which provides for them, just shift-click on any profile to quickly split the letters into separate columns. The O's when then become visible and apparent. Shift-click the profile again to unsplit when done.
The coloring of the Opening marker is controlled through the configuration variable PaintMPOpen. When set to the default option (true), the opening TPO of each bracket will be colored differently (typically blue) when brackets are split or when the profile color scheme calls for different colored brackets.
Display Overnight and Day Sessions separately
There are 2 possible ways to split a full session in 2 separate sessions:
The first method is to setup the TPO Profile chart with Minutes a "Special Profile Duration" option, ie with the number of Minutes corresponding to the Overnight session duration. In the example below (US equity indexes futures), the input "Minutes: 930" corresponds to the duration of the Overnight session which is running from 6 pm ET (the start time of the Globex Full session since 2020) and 9:30 am ET (the start of the US cash session).
The second (recommended) method is to use "Split Session" as "Special Profile Duration" and then to select the corresponding "Day Session" in the corresponding pop up list menu.
For easily differentiating the overnight session vs the day session (though different color or by using lower case for the overnight letter), please refer to this forum topic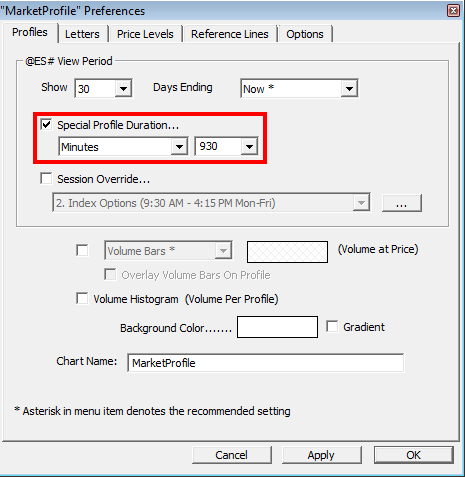
Toggle between specific Sessions
Here is the general procedure:
Please note that this will work in both following configurations:
a) You have a single day profile set up with the full session of the instrument as the "Session Override" (and the Special duration box is unchecked). In that case, pushing the comma key will toggle the session being used rom the full session to the day session and then back to the the full session (and so on).
b) You are using "split session" as "Special Duration" (see the Settings tab for more information on this settings). In that case the comma key will toggle the chart from a split session view to a day session view only.
Toggle Splits to View each Letter Separately
To view each letter separately, use the "Toggle Splits" feature. First, decide whether you want to view each letter separately for the whole chart, or just one Profile. If you'd like to Split just one day, right click that Profile and choose Toggle Splits - This Profile. To Toggle Splits on all Profiles, choose Toggle Splits - All Profiles.
What are Singles in TPO Charts?
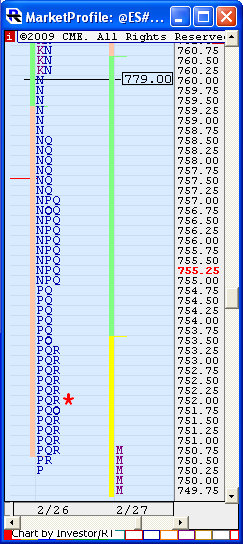
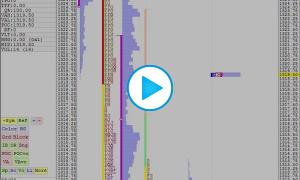
In TPO Profile charts, "singles" refer to prices within profiles which only contain a single TPO/letter but which are surrounded (above and below) by prices with at least two TPOs. If you look at the TPO profile chart to the right, notice that singles were created in the N period, as those singles have double TPOs both above and below them. However, if you look at the P at extreme low of the profile, that is not considered a single because there are no prices below it which contain 2 or more TPOs.
Given this definition of "singles", and based on user feedback, when singles are taken out (when the current price moves to touch a single from a previous profile that had not currently been touched since it's creation), then it is theorized that price will commonly continue to the extreme price of the profile in which the single was created. Therefore, singles are labelled with the extreme price of the profile in which the single was created. That extreme price will be the high price of the profile if the single was made on the way down, and the low of the profile if single was made on the way up.
NOTE: Singles within the current/rightmost profile will be labelled with their actual price, and not the extreme price. The label will change to the extreme price once the next profile begins, as the extreme price is only relevant in future profiles.
ADDITIONAL NOTE: As of version 10.0, an option has been added to the Price Levels tab of the TPO Profile preferences window titled "Label Singles with Extreme Price of Profile". If this option is not checked, all singles will be labelled with their actual price.
Notice in the chart to the right, that singles were created on the way down in the N period. While there are technically 5 single prices, the highest single made on the way down is the key single. If singles are created on the way up, the lowest key single is the one with the lowest price. And since this single is made on the way down, it is labelled with the high price of the profile (which happens to be 779.00). It is believed that if price returns to 760.00 during a subsequent profile ("takes out" the single), then price will continue to the high (779.00) of the profile in which it was created.
Why are my TPO charts labelled with dates that appear to be one day off?
The profiles in TPO Profile charts are labelled with the date on which they began (since the label is placed to the left of the profile). Therefore, on an overnight profile, each session begins on one day and then proceeds into the next day. So, for instance, the profile representing the session from 3/17/24 6:00pm to 3/18/24 5:00pm will be timestamped 3/17 and not 3/18, even though the day session for that profile is contained in 3/18.
Value Area computations: Method A vs. Method B
Method A
First, we count the number of TPOs in the profile, and take 70% of that number (70% is configurable by the user). This is the number of TPOs we're looking for in our Value Area.Next, the Point of Control (POC) is determined by finding the price which contains the most TPOs. If there is a tie (two or more prices with same number of TPOs), the price closest to the center of the profile is used as the POC. The number of TPOs in the POC are counted and this number is used as our initial TPO count. At this point the Value Area only comprises the POC and the number of TPOs in the POC.
We now inspect the two prices above and below the POC. If the two prices below the POC have more TPOs, those prices are added to the VA. Otherwise, the two prices above the POC are added. We increment our TPO count by the number of TPOs in the prices we just added to the VA. We continue repeating this process, adding two prices at a time, until we have met or exceeded our 70% TPO Count, and completed our VA. The upper price of this Value Area is considered the Value Area High (VAH). The lower price of the VA is considered the Value Area Low (VAL).
Method B
First, we count the number of TPOs in the profile, and take 70% of that number (70% is configurable by the user). This is the number of TPOs we're looking for in our Value Area.
Next, the Point of Control (POC) is determined by finding the price which contains the most TPOs. If there is a tie (two or more prices with same number of TPOs), the price closest to the center of the profile is used as the POC. The number of TPOs in the POC are counted and this number is used as our initial TPO count. At this point the Value Area only comprises the POC and the number of TPOs in the POC.
We now inspect the two prices above and below the POC. If the two prices above the POC have more TPOs, those prices are added to the VA. If the two prices below the POC have more TPOs, those prices are added to the VA. If there is a tie, we add both the two prices above and the two prices below. We increment our TPO count by the number of TPOs in the prices we just added to the VA.
We continue repeating this process until we come to the point where adding two prices would exceed our 70% TPO count, at which point we begin adding one price at a time using the same method. Once our 70% TPO count threshold is met or exceeded, our Value Area is complete. The upper price of this Value Area is considered the Value Area High (VAH). The lower price of the VA is considered the Value Area Low (VAL).
Adding Reference Lines in TPO charts
This feature doesn’t follow the usual rules of the Horizontal Reference line indicator applied to a Multi-pane chart. Here are the 2 main options for a TPO chart:
Adding reference line not linked to a V# variable
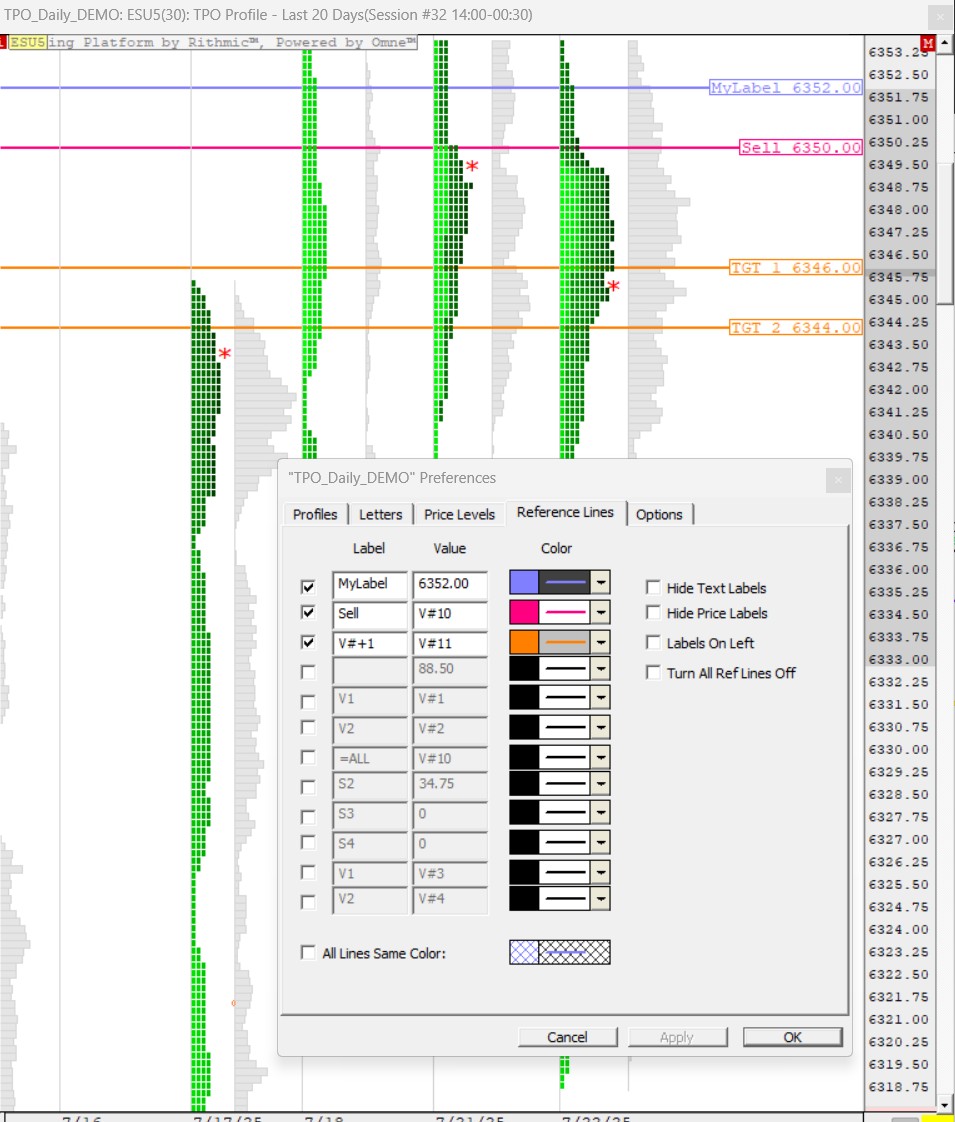
Just double click on the vertical price scale on a given price. A reference line will be added to the TPO chart: you may add a specific label and control the line style (color / width) through the “Reference Lines“ Tab of the TPO chart preference window.
Adding a reference line corresponding to a V# variable
For adding a single line, just add your selected V# variable, such as “V#10” under the Value Column, and the reference line will appear at the V#10 price level (wherever the V#10 variable price may be set within another Investor/RT features)
For adding multiple lines at once, just add your selected V# variable such as “V#11” under the Value Column, and add “V#+X” as label. For example, if X=1, then both V#11 and V#12 ref lines will be added to the TPO charts (sharing the same ref line style), knowing that the TPO charts will reflect here the V variable label as defined in the User Variable main preference window.
The 104 - TPO profile chart References lines video further details how to display key market levels (created from indicators on multi-pane charts) in a TPO profile chart.
View Bid or Ask volume within each TPO/letter
Prior to version 10.1, as long as they had access to tick data, users could point at any TPO in the TPO chart and view the volume, buy volume, sell volume, and delta of that single letter within the Info Box.
This feature was removed (by default) in versions 10.2 and later, as storing these volume levels within each TPO increase the memory consumption of TPO charts 3-fold.
With the current Investor/RT 64-bit version (release 15.1 and later) and the most recent RAM developments, this additional memory use is now fully compatible with most recent PC Hardware. There are two ways to recover this feature.
-
Set the "Letter Color" (in the "Letter" tab of the TPO Preferences) to either "Delta (TPO)" or "Volume (TPO)". Once you make that change, close and reopen the TPO chart and the information should be available again in the Info Box.
-
Go to *File > Preferences > Configuration and use the Find box to search for the Configuration Variable called MPLoadVolPerTPO and set this to True and press OK. Then Save your TPO chart and reopen it. Keep in mind this feature does pay a price in memory consumption.
Reminder : TPO profile charts vs Multipane charts
TPO profile charts is a separate type chart within Investor/RT. It shares a number of common features and menu actions with multipane charts such as saving, duplicating, exporting a definition, sharing on the Linnsoft Chart Share or managing the chart through the Object manager. The usual download and Multi-linking buttons are also available on the right bottom corner of the chart.
But some other chart features, settings or menus are specific to TPO charts: we provide below an overview of the user interface menus and keyboard shortcuts needed to easily control (symbol & session selection, profile merging/splitting features, chart scrolling controls, etc) and manipulate the different elements of a TPO charts
Accessing the key TPO profile menus: the Preference settings window, the Right click menu & the Infobox
There are 3 main interfaces that cover all the TPO chart settings controls
-
The TPO Chart Preference settings window: it can be accessed through a Double Click (or CTRL+Enter) action anywhere on the chart (or through the corresponding Right click menu option).
-
The TPO chart "Right Click" menu (right click anywhere on a chart to access it) includes a specific number of "Show" actions (including Show Infobox and toolsbars) and other dedicated TPO chart feature (such as merging/splitting profile, splitting bracket into columns, etc)
- The Infobox section of the charts, that can be also toggled on/off through the Tab key and which include (in its bottom section) a list of chart buttons controlling the apparence of the TPO charts. If the Infobox is not displayed, the same button can be found back in the TPO Chart toolbar which has (like any other I/RT toolbar) different position settings (pin to the right/left, pin to the botttom/top or floating)
Modifying easily the main TPO profile parameters: symbol & sessions, splitting brackets into columns, merging/splitting profiles...
Selecting another instrument
Push on the ~Sym button (at the bottom of the chart, below the Infobox), OR use the "Change Symbol" of th TPO chart toolbar, OR click on the chart and start typing a new instrument ticker.
Modifying a chart session
Other than accessing the "Profiles" tab of the Preference settings window, use the "Charting Hours" option of the Right Click menu (that offers a direct a choice of the Full and Day Session as defined within the instrument settings). Alternatively, pushing on the , (comma) on your keyboard will toggle the charting hours between both Full and Day Session.
Modifying the profile view (splitting brackets/Letters into columns)
For a given profile, the split columns can be activated/deactivated by a Shift + CLICK action (while pointing on the specific profiles) or through the "Toggle Splits - This profile" action on the right click menu. A "Toggle Splits - All Profile" will impact all profiles on chart, while the option can be by default activated (for all profile / the last profile") by selecting the corresponding options of the "Split Letters for:" menu in this Option settings tab
Profiles splitting & merging features
Merging 2 consecutive profiles
To merge a profile with the one located directly on its right, point your mouse on a given profile and access the Right click menu option "Merge Profile Right". The corresponding keyboard action is CTRL + Click
Splitting a single profile at a given Letter
To split a profile at a given letter, point your mouse on the corresponding bracket and access the Right click menu option "Split Profile at Letter". The corresponding keyboard action is CTRL + Double Click
To remove any merge or split from the chart
You can either, through the Right click menu, select the option "Undo Last shift/merge" or "Remove Splits/Merge". Removing all splits and merge from the chart can be also done with the keyboard action is CTRL + Shift + Click
Navigating through a TPO profile chart (Scroll and zoom features)
With current daily move (in ticks) of the main futures markets, finding a good TPO chart setup is becoming increasingly more difficult and is, in fact, a perpetual balancing exercise between
- selecting a reasonable ratio when it comes to aggregate multiple ticks into a single price level
- keeping a visually acceptable pixel height per Letter while fitting within your monitor vertical pixel capabilities
This is why custom colored "blocks" became a popular choice, as you may display square display blocks with a 5 or 6 pixel side, while the corresponding font size can't be read. In all cases, you will also need to easily scroll horizontally and vertically your charts.
Investor/RT includes many convenient keyboard shortcuts to easily control all these settings
Scrolling controls
- To scroll Vertically, use: the scrollbar OR the Mouse Wheel OR the Up and Down arrow keys
- To scroll Horizontally, use: the scrollbar OR CTRL + Mouse Wheel OR the Left and Right arrow keys
- To move any direction: click on the background and drag it (only possible in a direction that includes data)
Zooming in & out features
The controls are a bit different whether you are using blocks or Letters. Indeed, both the block height and width can be independantly controlled, while modifying a Letter height selection automatically results also in a width change (based on the font type and size)
When displaying Letters:
- To cycle through different font size (de facto equivalent to a Zoom in/out effect), push the + and - buttons (at the bottom of the infobox section) OR Shift + Up/Down Arrow keys
When displaying Blocks:
- To increase/decrease the block height: push the + and - buttons (at the bottom of the infobox section) OR Shift + Up/Down Arrow keys
- To increase/decrease the block width: CTRL+ Up/Dn Arrow keys
Toggling on & off components of a TPO Profile chart
The TPO chart Right Click menu includes specific "Show" actions:
- "Show Infobox" will toggle on / off the InfoBox. This can be also achived by pushing on the "Tab" button of the keyboard
- "Show Volume Bars" will toggle on / off the Volume Profile next to the TPO profile.
- "Show Lines" will toggle on / off any horizontal Lines on the TPO chart
- "Show Toolbar" will toggle on / off the dedicated TPO chart toolbar. As every other I/RT toolbars, it can also be activated/deactivated through the main "Window > Toolbar" menu of the main Toolbar
The other toggling on/off features can be accessed through the buttons (at the bottom section of the Infobox), with the same button features being also available through the TPO chart toolbar.
This includes, among other, the following convenient features : switching between Block and Letters, Cycling through the chart background color, letter (or block) color and font options, toggling on/off the VA & POC (for both market and volume profile), the IB & Opening Ranges or Singles Lines.
Please review the final paragraph of the Infobox support page for more details on these on/off/cycle actions.
Investor/RT offers a very flexible TPO Profile charting capability. These chart types may be referred to as TPO charts (TPO = "Time-Price Opportunity") or TPO Profile charts. This page discusses the content of the 5 Tabs of the TPO chart preference window that can be accessed by double clicking on the chart (or through the chart right click menu)
Additional ressources:
- The 101 - TPO chart preference video discusses the different options included in the Preferences settings window
- The 102 - TPO composite profile video reviews some of the "Special Duration" options (split session profile and profiles built from Daily TPO Letters) and the profile splitting/merging features.
- The 103 - TPO profile playback video focuses on the dedicated market replay feature for TPO chart.
- The 104 - TPO profile references lines video details how to display key market levels (originating from indicators located on multi-pane charts) in a TPO profile chart.
- This forum post discusses some split session features (for better identifying the overnight session)
The "Profiles" settings tab
View Period settings
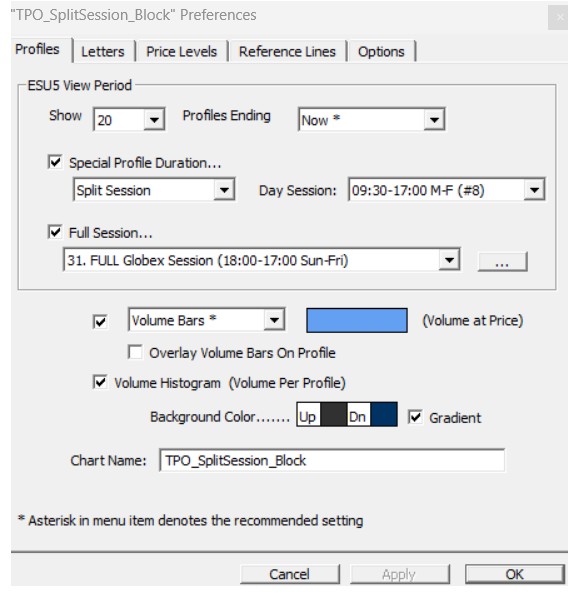
The TPO chart can be either made of a succession of:
- Individual profiles (one per day) based on a customizable daily session period: these profiles can be split (at any letter) or merged through a manual action on the chart
- "Special Duration" profiles: this includes, among other, split session and dynamic profiles, but also composite profile aggregating TPO over a weekly/monthly/quarterly/yearly period (with longer term periodicities being possibly built from "Daily TPO" letters)
The"Show" and "Profiles ending" checkbox control the number of daily profiles being displayed. Up to 119 Profiles can be shown simultaneously side-by-side in a given chart. (For the split session option, this means a maximum lookback period of 59 days)
Part 1: "Standard" Daily Profiles (Special Duration box is unchecked)
The TPO chart will display a single profile for each day. In this case, the session used to built the TPO letter is selected through the Session Override box. Typical choice here will be either the session number reflecting the instrument's full session or any pre-defined sub-session of the full session (the most common choice being the instrument "Day Session"). If no session is selected, the instrument full session will be used as default. You can toggle between the Day and Full session by pushing the comma key on your keyboard.
The Time per Letter is fixed as per the "Letters" preferences tab (see below) and can be any number between 1 and 1440 (with, of course, 30 minutes being the standard TPO bracket duration)
The following profile split and merge features are available:
Merging 2 consecutive profiles
To merge a profile with the one located directly on its right, point your mouse on a given profile and access the Right click menu option "Merge Profile Right". The corresponding keyboard action is CTRL + Click
Splitting a single profile at a given Letter
To split a profile at a given letter, point your mouse on the corresponding bracket and access the Right click menu option "Split Profile at Letter". The corresponding keyboard action is CTRL + Double Click
To remove any merge or split from the chart
You can either, through the Right click menu, select the option "Undo Last shift/merge" or "Remove Splits/Merge". Removing all splits and merge from the chart can be also done with the keyboard action is CTRL + Shift + Click
Part 2: "Special Duration" Profiles
For the following options (X Days, Weekly, Monthly, Dynamic and Split Session), the time per Letter is controlled by the Letter Tab input box. In the other cases (involving Daily TPOs), the Time per Letter will be automatically set to the number of minutes corresponding to the session (selected in the "Session Override" menu) so that a single Letter (or block) is reflecting a single daily profile
Special Duration: X Days
When this option is selected, each X single consecutive daily profile will be merged to form a single one.
Special Duration: Weekly, Monthly
When this option is selected, individual profile sessions will be merged according to a weekly / monthly calendar basis .
Special Duration: Monthly (Daily TPOs), Quarterly (Daily TPOs), Yearly (Daily TPOs)
When this option is selected, a single profile is made from the aggregation of single Daily TPO Letters according to a monthly / quarterly or yearly calendar period.
Special Duration: X Months (Daily TPOs), X Years (Daily TPOs)
When this option is selected, X consecutive Monthly / Yearly profiles (built from Daily TPO Letters) will be merged to form a single one
Special Duration: Dynamic
When this option is selected, the duration of each profiles is then dynamic based on price action. The user supplies two periods. The first period represents the minimum number of letters that each profile must contain in order to be complete. If the second period is considered X, price must break out of the last X bar in order to form a new profile. For instance, if the periods are 20 and 12, then once the 21st letter begins forming, price is monitored for breakouts of the range formed by the previous 12 letters. If price breaks out of that range during the 21st letter, then the 21st letter breaks away from the profile and begins it's own profile, which again will build for at least 20 letters before looking for breakouts.
Special Duration: Minutes
This option was used, prior to the Split Session option creation, as a split profile creation features. The number of Minutes was corresponding to the Overnight Session duration (For example, for the current Globex session starting at 6 pm ET and ending at 9.30, the number of minutes was 930 (ie 15x60+30)
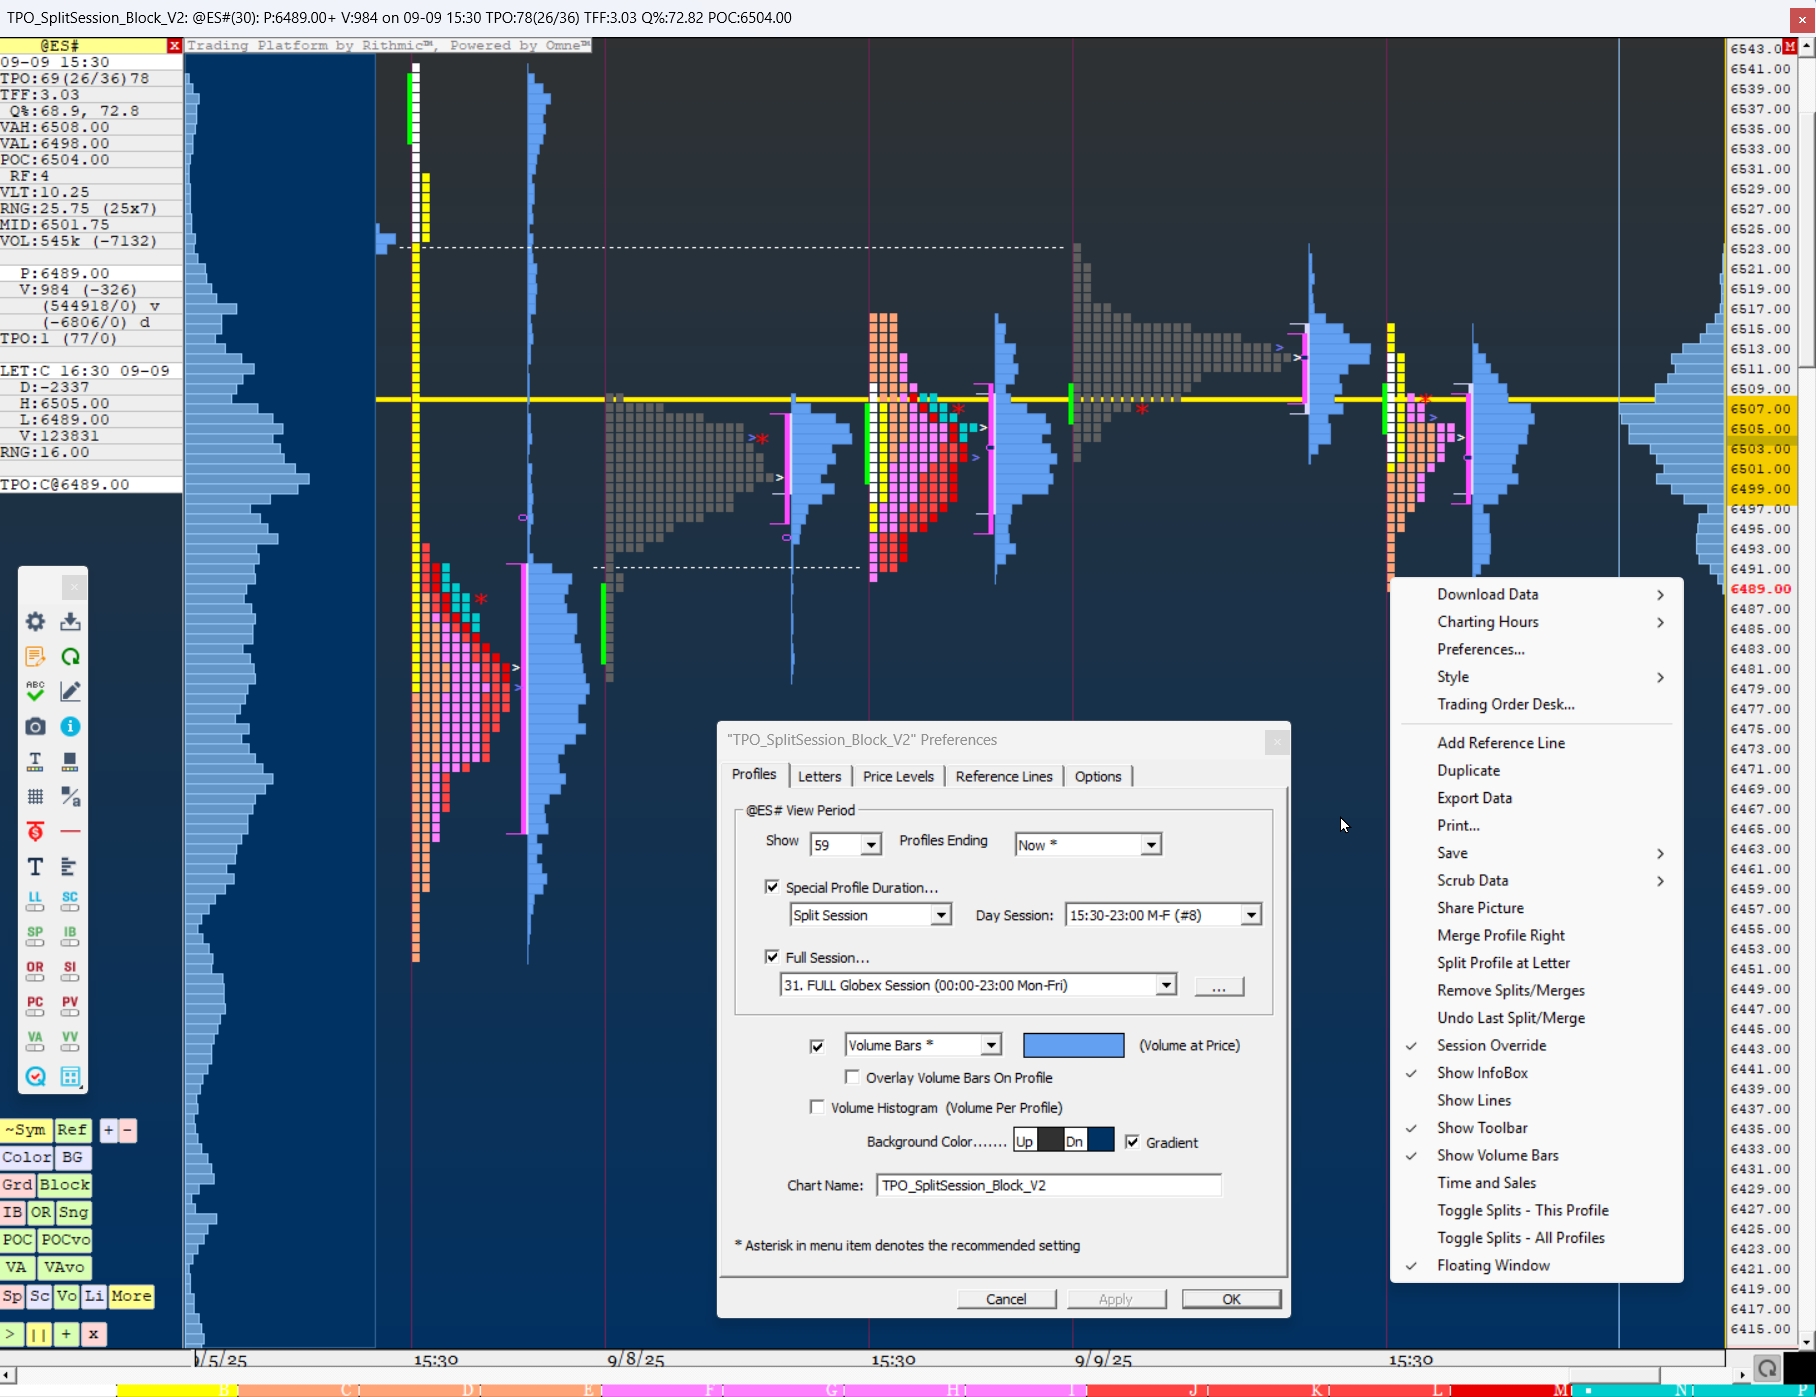
Special Duration: Split Session
This is the recommended setting for the automatic generation of an overnight splitting the full session into 2 separate session. Both a "Day" Session and Full session needs to be selected in the corresponding menus. The selected "Full" and "Day" Session are usually as set in the instrument setup, but not necessarily. The Full Session could be any sub-session of the instrument "Full Session" while the Day Session needs to be a sub-session of the Full Session. The Daily Profile (as defined by the "Full Session" input period) is split at the starting time of the Day Session. Only 2 session are being therefore displayed. Please note that, in the case of split session, the maximum number '(in the "show" input box) is 59, as this will result in 118 profile being displayed
Remarks:
- Some specific features (font type / custom color) have been developed for the Split Session option as discussed in this forum post.
- It is always possible to further manually a split session profile into 3 or more profiles using the manual "Split at Letter" feature (discussed below in the "Options" tab). This will be useful for analyzing market (such as the European Futures) which have a pre and post cash session.
2) Other settings of the "Profiles" Tab
Volume Profile feature
This feature is activated when selecting one of the "Volume Bars*" options. The histogram (or text) color is selected through the corresponding color box.
- Volume Bars* :an horizontal histogram with the cumulative volume at each price is displayed next to each individual TPO profile (* are designed to highlight the mlost commonly used setting through the different tabs). The exact volume figure can be found on the Infobox (based on the mouse pointing location)
- Trade Bars: an horizontal histogram with the cumulative number of trades at each price is displayed next to each individual TPO profile. The exact trade figure can be found on the Infobox (based on the mouse pointing location)
- Volume + Text: the volume figure appears on top of the histogram
- Volume Text: only the volume figure is displayed
- Volume TPO Text: both the volume figure and TPO count are displayed
Note: the Volume Bars can be toggled on / off through the "Show Volume Bars" option of the chart "Right click menu"
Volume Histogram feature
- It displays the cumulative volume for each profile as a vertical histogram. When tick data is available, the histogram is colored as per the total delta sign. The width of the column can be controlled by the configuration variable MPVolumeBarWidthPct
Background color
- When the gradient option is checked, two color menus are available. You can cycle through different standard background color by pushing on the "BG" button (at the bottom of the Infobox Section)
The "Letters" settings Tab
- The automatic mode will use by default the tick increment size of the instrument
- The custom range, introduced as points, needs to be a multiple of the instrument tick size (ie 1.0 will represent a Letter price range of 4 tick for the ES)
Time Per Letter
- Each letter may be setup to represent any number of minutes from 1 to 1440, with 30 being the universal default.
Start with Letter / First Letter Time / Custom Sequence
- The first letter can be modified (A is the Default) and the duration of the first period can be adjusted
- When Custom Sequence is checked, a specific sequence of letter can be used. For example, a "YZABC..." option which makes Y & Z the first two letters/periods of the day as opposed to A & B, is a popular setting among T-Bond Traders.
Letter Height, Letter Space & Font
- These settings let you select a specific font, letter height in pixel and horizontal space (between 2 letters). See more way to control the Letter/block height in the "Interface 101" help section
Letter Color / Shading option
 Price Range of each TPO Letter
A wide variety of color options are available (you can cycle through all color option by pushing on the "Color" button located at the bottom of the InfoBox section):
- A selection of individual color (red, green, blue, etc): when selected, the shading option is activated (with the letter / block getting darker as the day progress).
- Market Day is a predefined set of color reflecting the typical breakdown of a day session (gathering some consecutive bracket into single color)
- Vivid Spectrum is also a pre-defined set of color for each bracket
- Rainbow Days, Day of Weeks, Month of years will be popular choice when using weekly, monthly, quarterly and yearly special duration profiles
- Print Counts provides a 5 color (percentile based) breakdown for each TPO price level based upon the distribution of every TPO count on the chart (a white color reflects the lowest TPO count, while TPOs levels colored in red correspond to the highest count)
The following 4 color options provide an automated shaded blueish TPO Letters or Blocks upon their relative volume values:
- Volume (TPO): the Volume of Each TPO letter/block (this requires tick data)
- Volume (Bracket): the volume of each bracket
- Volume (Price): the given total volume for a given price level
- Volume (Profile): the total volume for the whole profile duration
There are also 4 color options for controlling a red/green relative shading based on a Delta value (which requires to have tick data available for the corresponding period)
- Delta (TPO): the delta of Each TPO letter /block
- Delta (Bracket): the delta of each bracket
- Delta (Price): the given total delta for a given price level
- Delta (Profile): the total cumulative delta for the whole profile duration
The following other bracket specific coloring options (most useful when profiles are being split) are available:
- The Open/Close option will color in red/green the TPO letters/block of the bracket section corresponding to a candle body (with the wick being grey, and Open=Close situation corresponding to a block color).
- The High/Low color option is similar to the Open/Close color, but with the full candle height, including the wick (ie every TPO letter of a given bracket) will be colored in red/green/black.
- Up/Down also color every bracket according to the following rules: up brackets (higher high / higher lows) will be green, down bars (lower high / low low) will be red and inside or outside bars will be white.
- Better Volume is similar to Volume (Bracket), but with 2 differences: it will only compare the volume of a given bracket letter (with the volume of the corresponding bracket letter on other profiles), and the resulting color set will not be shaded, but based upon a discrete color for each percentile group (with green reflecting a median distribution, darker color a relative strength, and lighter color a relative weakness) .
The Value area option will color both the Value Area Range of the TPO profile and of the Volume Profile, with both the VA colors being set in the Price levels tab (the color of the non VA range of the TPO profile is by default black)
Finally, with Custom color, you can pick a specific color for each Bracket: the color selection is made by clicking on the corresponding Letter rectangle located below the chart timeline.
Note : for "split session" profiles set with the corresponding special duration option, please check this forum post to review how to control the font type or/and the custom color for the Overnight session
Draw block option
- It includes a dedicated input box for the width of the block (while the height of the block is controlled through the "Letter Height" selection box). See more ways to control the block width in the "Interface 101" help section
Repeat Letter 3 times
- When a ten minute period is selected as Time per Letter, the same letter will be used for 3 consecutive 10 minutes brackets.
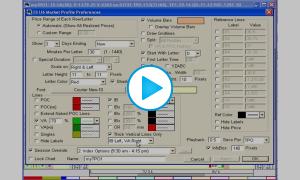
The "Price Levels" settings tab
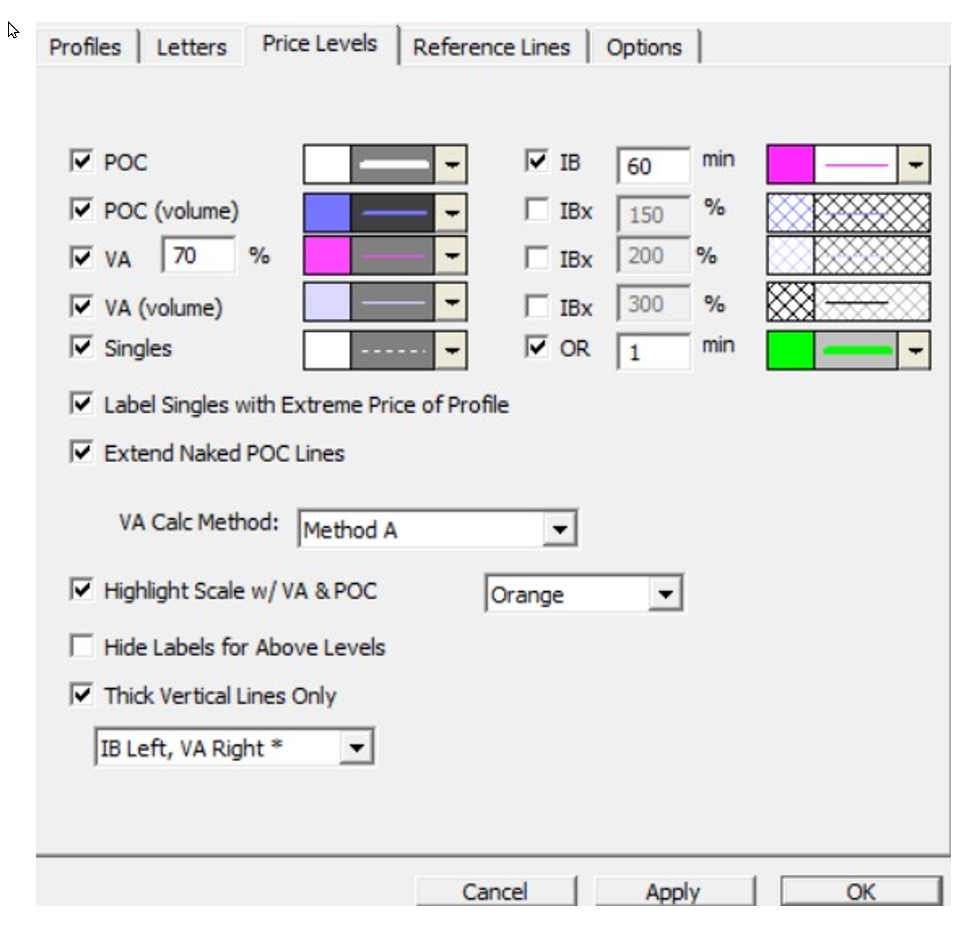
The first column includes color and line settings for the POC, Value Area and Singles of the TPO profiles and the POC and Volume area for the Volume Bars
- The first box of the second column includes the Initial Balance settings (Color and a minute input selection boxes in case you would not use the default 60 min value) . 3 IB extension range multipliers (typically 150%, 200% and 300%), derived from the IB period, can be introduced in the following boxes. Finally, the last box corresponds to the Opening Range (typically 1 min)
- When the vertical thick lines option is not checked, all these lines each have their own color and width (dotted line must be 1 pixel wide), are labeled with their price (optional), and drawn for both the current and previous session.
- Naked POC lines can be extended (upon checking the corresponding box)
- The "quick start" guide further discusses the VA calc method option (Method A is the one commonly used by charting package) and the meaning of singles (and the way line and label are selected). Please note that the MPH indicator includes a "Single" features that allows to display naked singles lines (and possibly filter some of them based on some custom indicator based conditions)
- The Value Area range of the Last Profile can be highlighted in the right vertical scale (with several highlight color being available) and the Labels of the Above levels can be hidden.
- Finally, instead of displaying line, the corresponding Value Aread, IB and Opening Ranged can be displayed as thick vertical lines, either all located on the Left or right side of the profiles, or with the IB ranges bars on the left and the VA area range vertical bars on the left of the profiles (this last option being the most commonly selected one). The POC are highlighted in this case with the ">" signs
Miscellaneous Remarks:
- The small "o" on the VA vertical thick line represents the midpoint of the profile.
- The closing price of each session is marked by a large red asterisks * to the right of each profile.
- The Letter O is used to identify the first TPO/print of each bracket, as further discussed in the "Quick Start" guide
The "Reference Lines Tab" settings tab
The reference line feature is discussed in the "Quick start" help page.
The "Options" settings tab
 Split Letters & Highlight developing VA/POC features
An option to split automatically each bracket into a separate column (corresponding to the duration of the Time per Letter input) is available. When letters are split, the historical developing VAH, VAL, and POC may be charted), so the user may review where these values were during each letter period. Also, the opening letter of each period is printed in bold to clearly show where each period opened.
For a given profile, the split columns can be activated/deactivated by a SHIFT + CLICK action (while pointing your mouse on a specific profile) or through the "Toggle Splits - This profile" action on the right click menu. A "Toggle Splits - All Profile" will impact all profiles on chart, while the option can be by default activated (for all profile or the last profile) by selecting the corresponding option of the "Split Letters for:" menu in this Options settings tab
Horizontal and vertical scales, Gridlines & currrent price highlighter
- The height of the timeline can be adjusted (it is used to hold the color selection boxes for each bracket when custom color is selected)
- Gridlines can be turned on/off with a dotted line option.
- The vertical price scale can be drawn on the right side, left side or on both side of the chart, with color options to highlight the current price in the selected scale(s).
Profile Playback feature
The current session, or prior sessions/days can be played back using a variety of options, such as playing back one letter every 0.5 seconds. Review this video to learn more about TPO charts playback. The fastest recommend speed is 0.05 second per change
A Tip: Set MPPlaybackPauseEachSession to true if you want TPO Profile Chart Playback to pause at the end of each session. Set to false to continue playback automatically to next session.
TPO Chart InfoBox (and Highlighter)
The InfoBox can be toggled on and off by pushing on the Tab key on your keyboard or through the corresponding chart richt click "Show Infobox" menu. When the InfoBox is on, mouse/cursor movements across the chart will control the information displayed on the separate section of the InfoBox. The highlighter itself is activated when moving the mouse while clicking on the shift key, highlighting the cursor's row/price and the cursor's letter. The info box provides feedback on the location of the cursor, including profile-specific, row-specific, and letter-specific information as discussed in details here.
Cumulative Profiles (on the right and left section of the chart)
Cumulative profiles over the last X session, for both TPO and Volume profiles, can be added on each side of the charts. X=2 on a split session TPO chart will correspond to a full session profile being displayed (during the Day Session action).
The TPO Profile Info Box can be brought into view at any time by pressing the Tab key when viewing a TPO Chart. Press Tab again to hide the Info Box. The data in the Info Box updates as the mouse is moved within the TPO Chart to point at a particular profile or letter. The table below describes the data that is displayed in the top part of the box which is broken into 4 sections as labeled in the image provided.
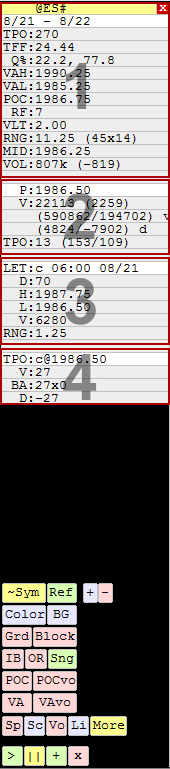
| 1 First Section Provides information related to each profile | |
| Symbol | The top line shows the symbol charted in the profile. To the right of the symbol is a red box with an X in it. Click that X to close the InfoBox. When the InfoBox is closed, a red box with an "I" will appear, which toggles the InfoBox back on. The InfoBox can also be toggled on/off with the tab key on the keyboard. |
| Date/Time | The second line/row shows the date/time of the profile over which the cursor is placed. |
| TPO | TPO = Time Price Opportunities. This is the total number of letters in the profile. If there are 8 D's, that counts as 8 towards the TPO count. This TPO count excludes single prints at the extremes of the profile. To the right of the TPO count, in parenthesis, you have (TPOs above POC, TPOs below POC), followed by the number of TPOs including the single prints at the extremes. The TPOs above and below will only be shown if the TPO checkbox is checked in the Price Levels tab of the TPO preferences. |
| TFF | Trade Facilitation Factor Number of total TPO's divided by the range of price for the profile. The higher the value, the less trend was present. Normal days have a high TFF value. |
| Q% | Quadrant of Open and Close (%) This represents the relationship of the first/open and last/close price to the overall range. The value can vary anywhere from 0% (first or last trade at very bottom of range) to 100% (first or last trade at very top of range). |
| VAH | Value Area High |
| VAL | Value Area Low |
| POC | Point of Control This represents the price/row in which the most letters reside. It is the widest row. This price was achieved in more 30-minute segments of the day than any other price. |
| RF | Rotation Factor Each letter is given a +1 if it's high is above high of previous letter, and a -1 if it's high is below high of previous letter. In addition, a +1 or -1 is added based on whether the low was above or below the previous low. Each letters RF (anywhere from -2 to +2) is summed to provide the RF of the profile. |
| VLT | Volatility Average range of the letters within a given profile |
| RNG | Range Range of price of each profile. To the right of the range, in parenthesis, is (vertical height of profile in prices/TPOs x width of profile in TPOs) |
| MID | MID price of the session, ie (High of the Day + Low of the Day)/2. Corresponding price is displayed with a letter "o" whenever the profile Value Area is highlighted through a vertical line |
| VOL | Volume Total volume of each profile. To the right of the volume, in parenthesis, is the delta of the profile (total volume that traded at the ask price minus total volume that traded at the bid price). The delta will only be available and accurate if you have tick data for the profile in question. |
| 2 Second Section Provides information related to each price in each profile | |
| P | Price |
| V | Volume traded at that price within that given profile. To the right of the volume, in parenthesis, is the delta of all the trades at that price within the given profile. In addition, on the next line, in parenthesis, is (total volume in the profile above this price, total volume in the profile below this price). |
| TPO | Number of TPOs/letters at that price in that profile. To the right of the TPO count, in parenthesis, is (number of TPOs above this price, number of TPOs below this price). This TPO count excludes single prints at the extremes of the profile. |
| 3 Third Section Provides information related to each letter in each profile | |
| LET | Letter represents all matching letters in the profile. For example, if you see "LET: K 13:00 06/30", that means this section applies to all trading in the K bracket and covers all the Ks in the profile. To the right of the letter is the time/date the bracket begins. |
| D | Delta of the period covered by the letter (delta of the bracket) |
| H | High of period covered by the letter (high of the bracket) |
| L | Low of period covered by the letter (low of the bracket) |
| V | Volume trading during the period covered by the letter (volume of the bracket) |
| RNG | Range of price of the letter |
| 4 Fourth Section Provides information related to each TPO (individual letter) in each profile | |
| TPO | Shows the letter and price (represents a single letter or TPO, a single price & time opportunity) |
| V | Volume of that single TPO |
| BA | Bid x Ask Volume of that TPO (volume traded at bid x volume traded at ask) |
| D | Delta of that TPO (difference between the ask traded minus bid traded volume. |
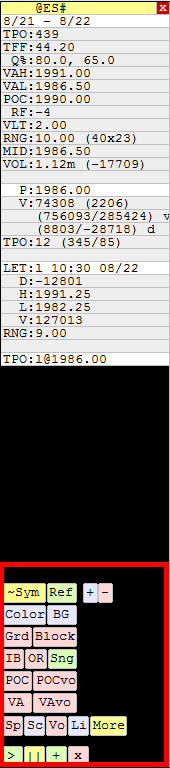
| This section describes what happens when clicking on the various buttons that are seen at the bottom of the InfoBox section of TPO Profile charts. This Info Box can be toggled on/off with the tab key. | |
| ~Sym | - Change Symbol of the chart |
| Ref | - Toggle the "Reference Lines" on or off. |
| Color | - Cycles through the various letter color options available. |
| BG | - Cycles through various background colors |
| Grd | - Toggles the gridlines on and off |
| Block | - Toggles "Draw Blocks" on and off. "Draw Blocks" draws squares in place of letters. |
| IB | - Toggles the IB (Initial Balance) lines on and off |
| OR | - Toggles the OR (Opening Range) lines on and off |
| Sng | - Toggles the Single lines on and off |
| POC | - Toggles the POC (Point of Control) lines on and off |
| POCvo | - Toggles the POCvo (volume-based Point of Control) lines on and off |
| VA | - Toggles the VA (Value Area) lines on and off |
| VAvo | - Toggles the VAvo (volume-based Value Area) lines on and off |
| Sp | - Toggles the Split Letters on and off |
| Sc | - Scale - Cycles between scale on left, scale on right, and scale on right and left |
| Vo | - Toggles the Volume (or Trade) Bars on and off |
| Li | - Cycles between 5 states: Thick Vert Lines Left of Profie, Thick Vert Lines Right of Profile, Thick Vert Lines IB Left VA Right, Thin Vert Lines w/ Hor Lines (no Lables), and Thin Vert Lines w/ Hor Lines (with Labels) |
| More | - Brings up the preference window |
| Playback Controls | |
| > | - Playback Play |
| || | - Playback Pause |
| + | - Playback Advance One |
| x | - Playback Stop/End |
| Keystroke | Resulting Action | Notes |
| Up Arrow | Scroll Chart Up One Row | Only has effect when chart is too big vertically for visible window. |
| Down Arrow | Scroll Chart Down One Row | |
| Right Arrow | Scroll Chart Forward One Day/Profile | Decreases the "X" in "Show X Profiles/Days" by one |
| Left Arrow | Scroll Chart Back One Day/Profile | Increases the "X" in "Show X Profiles/Days" by one |
| Shift-Right Arrow | Scroll Chart Forward One Day/Profile | Decreases the "X" in "Ending X Days Back" by one |
| Shift-Left Arrow | Scroll Chart Back One Day/Profile | Increases the "X" in "Ending X Days Back" by one |
| Shift-Up Arrow | Zoom In Vertically | Increases the Letter/Block height pixel value by one |
| Shift-Down Arrow | Zoom Out Vertically | Decreases the Letter/Block height pixel by one |
| Ctrl-Up Arrow | Zoom In Horizontally | Increases "Block Width" by one (for "Show Blocks" only) |
| Ctrl-Down Arrow | Zoom Out Horizontally | Decreases "Block Width" by one (for "Show Blocks" only) |
| Ticker Symbol - Enter | Changes to that Ticker Symbol | Type in a new ticker symbol (like "MSFT") then hit Enter |
| Esc | Close the Chart | The Escape key can be used to close most all windows types |
| Ctrl-Enter | Open Chart Preferences | The Ctrl-Enter combination will open prefs on most all windows |
| Double-click | Open Chart Preferences | Double-click anywhere inside the chart window |
| Shift-Click | Toggles Splits | Toggles Splitting of Letters for Profile clicked on |
| Ctrl-Click | Merges Profile Right | Merges the Profile clicked on with the one to it's right |
| Ctrl-Double-Click | Splits Profile at Letter | Splits Profile into two Profiles at the clicked letter |
| Ctrl-Shift-Click | Removes Splits/Merges | Removes any splitting or merging from the chart |
| Shift-Move | Crosshairs/Highlighter | Hold down the shift-key while moving cursor across chart. This only works when the InfoBox is active. |
| Shift-Click "Block" | Cycles Through Fonts | Hold down the shift-key while clicking on the "Block" button in the InfoBox to cycle through all the available fonts. |
-
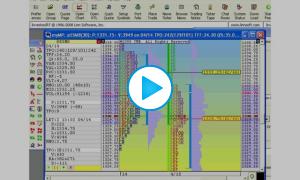
101 - TPO Profile - Chart Preferences
This video highlights the TPO profile preferences.
-
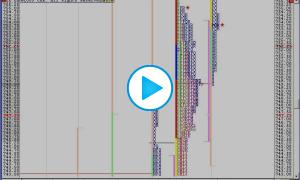
102 - TPO Profile - Composite Profiles
This video demonstrates how to build automated composite profiles (weekly, monthly, quarterly, yearly, etc), as well as how to split or merge daily profiles.
-
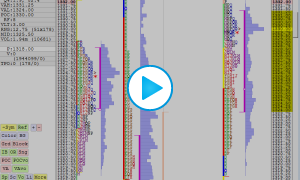
103 - TPO Profile Playback Demonstration
This video demonstrates how to use the TPO Profile playback feature to quickly jump to the current day and play it back at various rates.
-
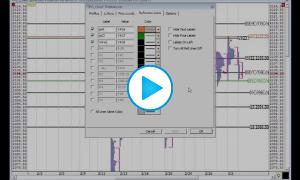
104 - TPO Profile Chart Reference Lines
This video demonstrates how to manage Reference Lines in TPO Profile Charts, from dropping down manually to importing levels from external sources (multi-pane charts) which are automatically updated. Video also covers extending reference lines to provide access to many more than the limit of 12.
-
Alerting to DVA Movement
This video demonstrates how to create alerts when the developing value area high or low moves up or down.
-
Automating Pivot, Support and Resistance Levels
This video demonstrates how to automate pivot levels, support and resistance levels and the pivot point price on the TPO profile charts.
-
Exporting Price Levels
- Even if the user interface for TPO Profile charts has been revised since this video was released in 2006 (with the introduction of Tabs), its content is still fully pertinent.
This video demonstrates how to transfer TPO Profile lines such as VAH, VAL, POC, etc, over to bar or candle charts, and have them automatically update on a tick by tick basis.
-
QuoteBoarding TPO Profile Levels
This video demonstrates how to plot TPO Profile Levels (VAH, IBH, etc) in the QuoteBoard. User variables are used to transfer these dynamic prices from the TPO charts to the QuoteBoard.
-
TPO Profile // Playback 03-mar-2011
Playback of the day session on ES on March 3, 2011 - using the TPO playback feature. --
-
TPO Profile Charts in version 8.5
- Even if the user interface for TPO Profile charts has been revised since this video was released in 2006 (with the introduction of Tabs), its content is still fully pertinent.
This video discusses many of the recent innovations in TPO Profile charts, including Singles, Naked POCs, individual profile splitting, custom letter colors, sharing of charts, and more...