Price Statistics requires the Volume Analysis Package.
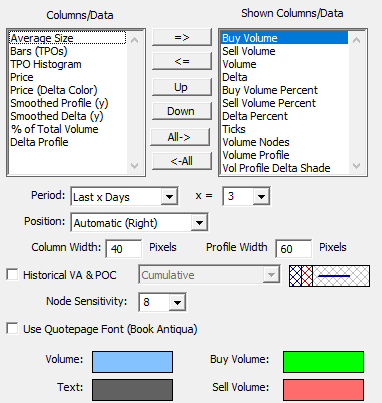
This indicator presents cumulative volume based information for each price over a user-specified period of time expressed in days or bar count. Data items include Buy Volume, Sell Volume, Volume, Buy Volume Percent, Sell Volume Percent, Ticks, Average Size, Delta, Delta %, Price (Delta Color), Bars (TPOs), TPO Histogram, Volume Profile, Volume Profile Delta Shaded, Smoothed Profile, Smoothed Delta, % of Total Volume, Delta Profile, and Volume Nodes. Any or all data columns may be displayed in any desired order. Each data item is color shaded based on its relative value. Custom colors are available for buy volume, sell volume, volume, and text. Optonally, the font and style of quotepages is used display the price statistics. Specify the font using File > Preferences > Quotepage Defaults. There is also an option to plot the historical Value Area (VA) and Point of Control (POC) for various periods. View the Preferences tab for more information on each data item.
Presentation

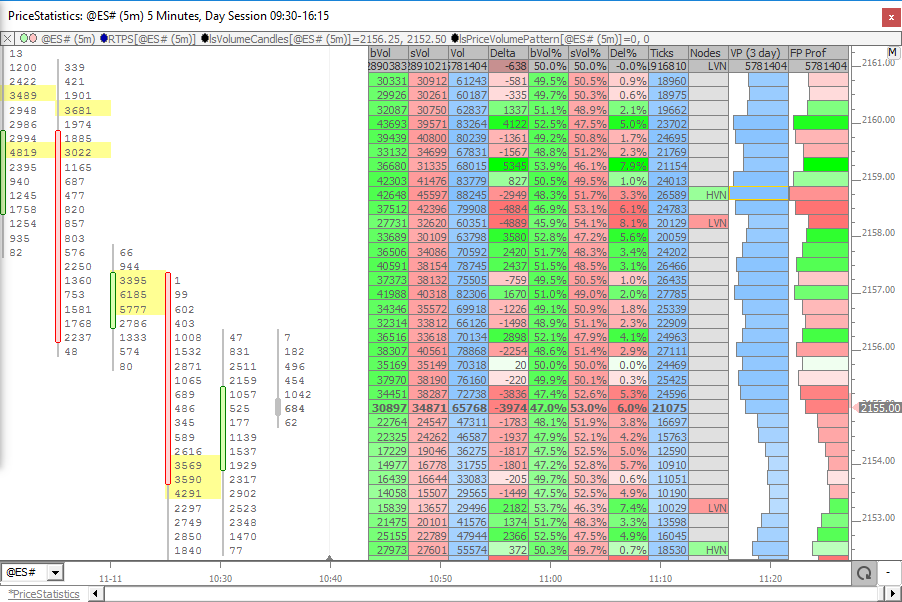
The chart above displays the Price Stastistics Indicator on the right side of the chart. Volume at each price within each bar is displayed using the Volume Candles (RTX) indicator, along with the Price Volume Pattern indicator highlighting high volume prices in yellow.


