Footprint® Charting Tools
Investor/RT has an extensive FootPrint® charting and analysis tools, having been a pioneer in the development of Footprint charting almost 20 years ago. A history of Linn Software's role with Footprint charting is found here. The central component of Investor/RT's Footprint Toolbox is the VolumeScope® charting extension.

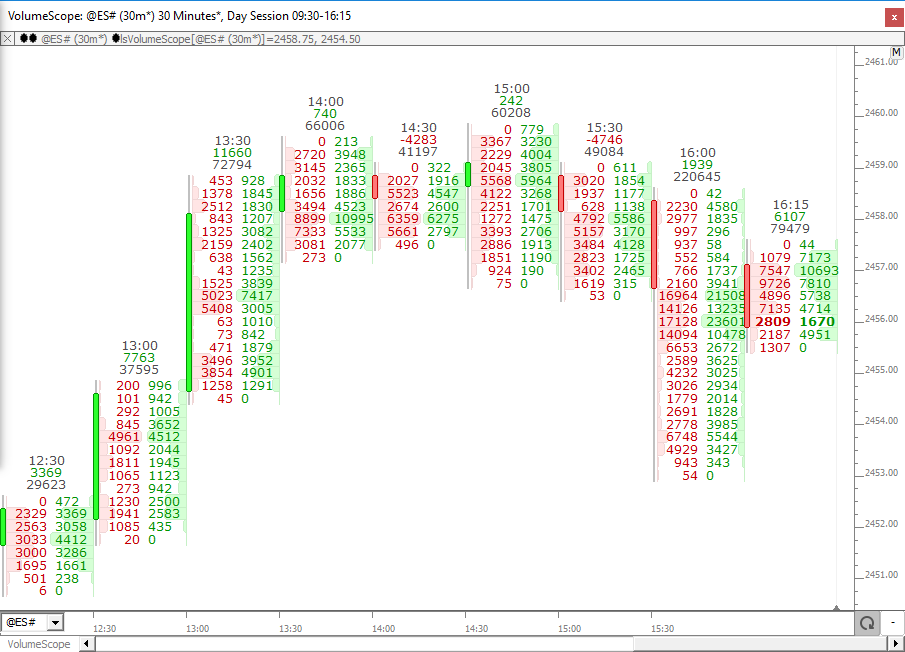
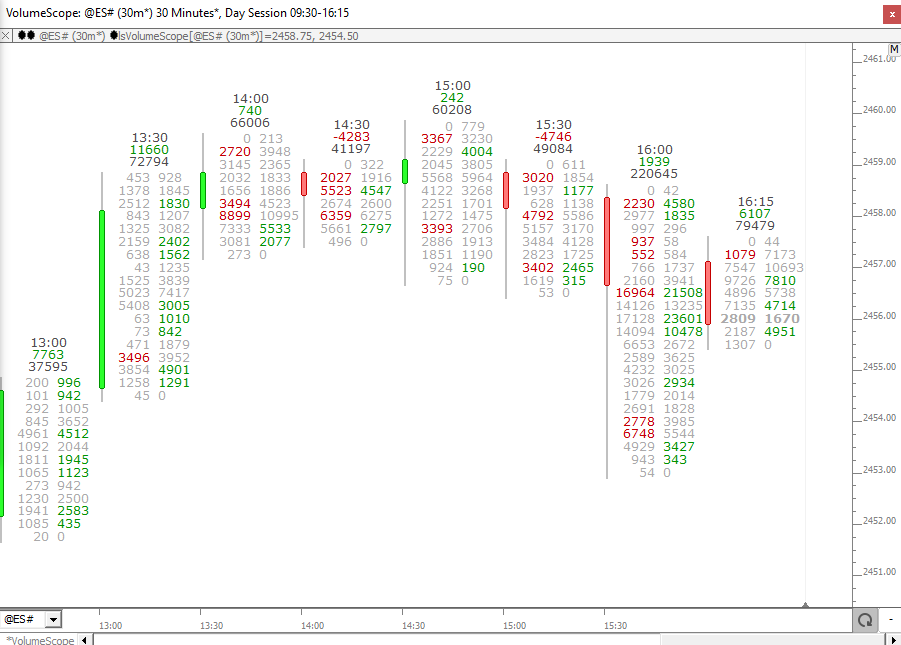
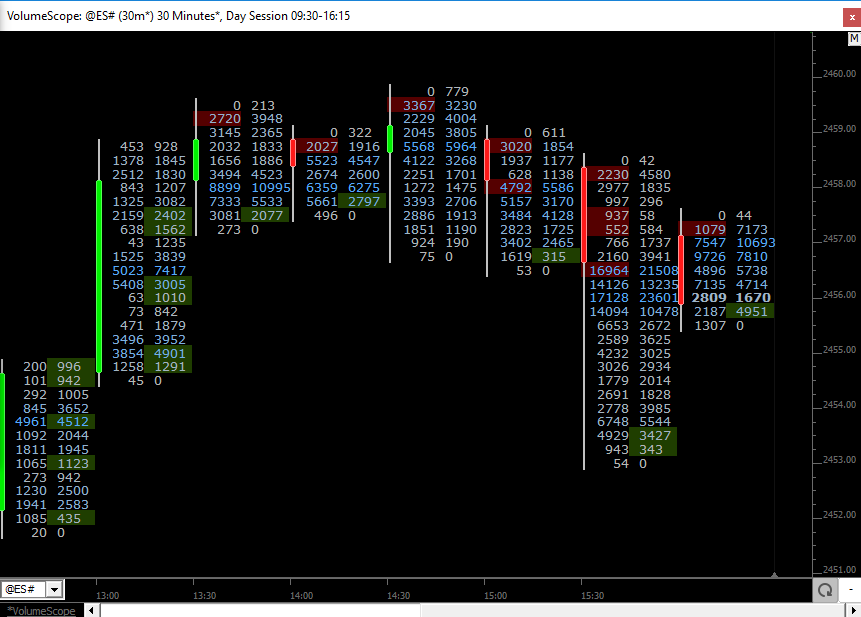
VolumeScope is the best in class Footprint(r) charting available, allowing the user to view per bar market order flow under a microscope, closely inspecting the volume at price data with great flexibility. The VolumeScope indicator has three primary components: Background, Text, and Candle. Each is optional and each has a variety of data and presention settings. Volume is broken down into Ask-Traded Volume (Buying) and Bid-Traded Volume (Selling) at each price. VolumeScope builds upon this information with profiling, coloring, and scaling options based upon relative volume, delta, imbalance, and much more. The indicator makes optimal use of the horizontal and vertical space available for each bar, overlaying text upon a visual profile aside a narrow candle to present a complete picture of the price and volume activity. Users may overlay the Scope over each bar, or detach the Scope from the bars and display them in the right margin allowing for both vertical and horizontal zooming and scaling while still seeing the details within each of the most recent bars. Each bar may be titled with cumulative information for that bar such as volume, delta and time.
Footprint is a registered trademark of Linn Software, Inc. All Rights Reserved

- Background - Background drawing options include Bid Ask Profile, Bid Ask Profile (Left), Volume Profile, and Shaded Block.
- Color (Background) - The Background Coloring options are dependant on the Background selection. For Bid x Ask Backgrounds, the color options are Bid Ask, Bid Ask Shaded (Text), Bid Ask Shaded (Chart), Strong Side (Same Price), Strong Side (Imbalance), Constant (Text Color), Volume Shaded (Text), and Volume Shaded (Chart). For all other Background (Delta, Volume, etc) the options are Delta, Delta Shaded (Text), Delta Shaded (Chart), Constant;Volume Shaded (Text), and Volume Shaded (Chart).
- Volume, Bid, Ask, and Fade Colors: These color are used for background coloring. The "Fade" colors is used when any of the "Shaded (Text)" Color options are selected and allows the user to provide an alternate fade color to the chart background color. When "Shaded (Chart) options are selected, the Volume, Bid, and Ask text colors will fade towards the charts background color for smaller magnitude values. When "Shaded (Text) is selected, the Volume, Bid, and Ask colors will instead blend towards the Text color for smaller magnitude values.
- Border: Three border options are available for the background: Auto, Manual, None. When Auto is selected, the border will be automated with a slightly darker or lighter color than the background itself. When Manual is selected, the user supplies the constant border color. When "None" is selected, no border is drawn.
- Hollow - When checked, the background shape is drawn hollow with the border/edge shaded based on the background color specified.
- Scale/Shade to Max of - Three choices are available: Bar, Visible, and Chart. This option refers to the scaling of the profiles. Choosing Bar will scale each profile to the max volume at price of that bar. This option has the advantage of maximizing the space available but the disadvantage of not allowing comparison among and between profiles. Visible will scale each profile using the max volume at price of all bars that are visible, allowing for comparison among the visible profiles. Chart will scale each profile using max volume at price of all bars in the chart.
- Scale Profiles / Colors - Offers three choices for the basis to use when scaling the Volume Profile: Low Constrast, Lower Contrast, and Lowest Contrast. If this option is unchecked, a linear scaling will be used (if a price contains twice the volume of the price above it, its histogram bar will be twice as wide). When scaling is turned on, the user has three options the contrast between the width of the large volume prices and the small volume prices descreases, with the smaller volume prices getting more ink/width. This option also effects the shaded color options, descreasing the contrast in color between large volume prices and small volume prices (both for shading of the profile and the text if applicable).
- Text - Options are available to display either Bid x Ask Volume, Bid x Ask Outside, Delta, Volume, Trades, Average Size, or Price, textually at each price. In order for this text to display, there must be sufficient space both vertically and horizontally for each price to be printed as text. Use the shift scrollwheel for vertical zooming to increase/decrease the amount of vertical space per price. Use the scrollwheel to increase the horizontal space available to each bar (zoom in horizontally).
- Color (Text) - Similar to the Background Color options, the Text Color option The Background Coloring options are dependant on the Text that is displayed. For Bid x Ask Text choices, the color options are Bid Ask, Bid Ask Shaded (Text), Bid Ask Shaded (Chart), Strong Side (Same Price), Strong Side (Imbalance), Constant (Text Color), Volume Shaded (Text), and Volume Shaded (Chart). For all other Text choices (Delta, Volume, etc) the options are Delta, Delta Shaded (Text), Delta Shaded (Chart), Constant;Volume Shaded (Text), and Volume Shaded (Chart).
- Volume, Bid, Ask, and Text Colors: These color are used for textcoloring. The "Text" colors is used when any of the "Shaded (Fade)" Color options are selected and allows the user to provide an alternate fade color to the chart background color. When "Shaded (Chart)" options are selected, the Volume, Bid, and Ask colors will fade towards the charts background color for smaller magnitude values. When "Shaded (Fade) is selected, the Volume, Bid, and Ask colors will instead blend towards the Fade color for smaller magnitude values.
- Font- A variety of font styles are available, including the choice "Quotepage". When Quotepage is chosen, whatever font style is specified for the Screen Font in File > Preferences > Quotepages > Quotepage Defaults, will be used for the text. This gives the user access to the full range of available fonts on his system. Keep the Quotepage preferences window open and experiment with various fonts, applying the preference window after each change, and then clicking on the chart with Volume Scope to see the result, until a satifactory font is discovered.
- Size - The list to the right of the font allows the user to specify the maximum font size at which the text should be drawn. The size will be variable and reflective of the amount of space available for each price vertically, up until this maximum size limit.
- Position (Text) - This listbox will ONLY appear when Text is turned on but the Background and Candle are turned off (Text Only). Choices for horizontal position of text include: Left, Right, Center, Left Center, and Right Center. This allows users to horizontally stack up to 5 items of text within the space of each bar, each with it's own unique horizontal position.
- Overlay Text on Profile - Optionally overlay the volume at price as text on top of the Profile. This option is only available when both Background and Text are turned on, and only when Bid x Ask is not chosen for either Background or Text.
- Scale Values - Divides the volume at each price by a divisor to reduce the number of characters needed to infer the volume levels at each price. This option is only available when the Text is "Volume".
- Candles - When checked, draws a Candlestick and enables Color Controls for specifying the Up and Down body color of each candle. Many of the Candle options below are ONLY available when Candle is checked but Text and Profile are unchecked (Candle Only).
- Wick - Candle Wick color, along with options for the width of the candle wick and an optional unique border color for the wick. If the checkbox left of the wick color is unchecked, the wick will share the color of the body of the candle.
- Width - Width of the candle wick. (This option is only available when Candle is checked and Profile and Text is unchecked.)
- Border - Border color of the candle wick. (This option is only available when Candle is checked and Profile and Text is unchecked.)
- Rounded Edges - When the Rounded Edges checkbox is checked, the corners of the candle body will be rounded. This will also apply to the candle wick if the wick is wide enough (4 pixels or greater). The background Profiles or Blocks will also be rounded if this option is turned on.
- Candle Up Fill - Body Fill color for Up Candles.
- Up Border - Body Border color for Up Candles.
- Down Fill - Body Fill color for Down Candles.
- Down Border - Body Border color for Down Candles.
- Detach Last X Bars - When this option is checked, the Volume Scope will draw to the right of the rightmost bar, instead of overlaying the bars or candles. This way, the user can zoom the chart out (make bars smaller horizontally) and yet still see the text and profiles in the user specified width in the right margin.
- Title - Options to Title each bar with Delta, Time (Secs), Time (hh:mm:ss), and/or Volume, in any order desired. This comes in especially handy for keeping up with the ending times of each bars when detaching the indicator from the underlying bars and drawing in right margin.
- Custom Position - Option to position the indicator within the left half of bar, or right half of bar. With this option, users may stack 2 Volume Scopes side by side within each bar with different preferences.
- Hide Underlying Bars - This option is turned on by default, and will force the underlying bars into invisible mode when adding the Volume Scopes to the chart, so they do not interfere with the drawing of the Volume Scopes.
No examples. Let us know if you'd like to see one added.


