Polynomial Regression Channel (RTX)
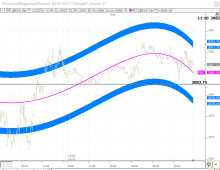
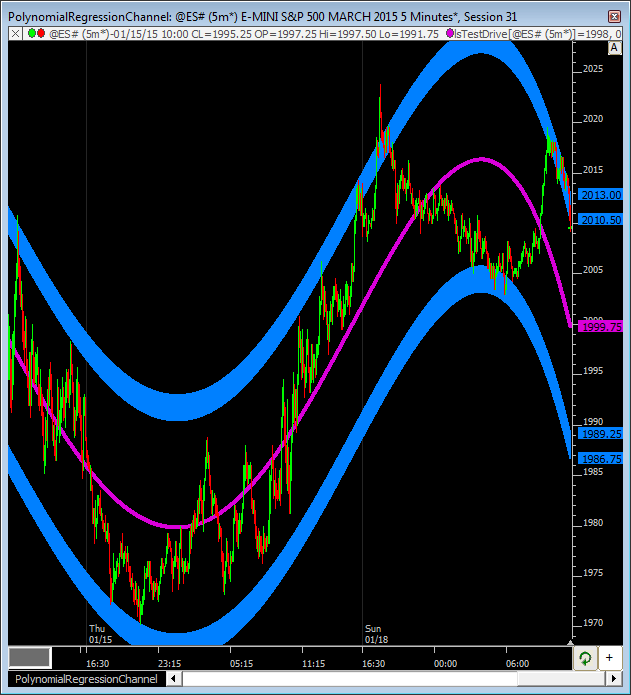
Polynomial Regression Channel (PRC) is an RTX Extension indicator that draws a best fit n-degree polynomial regression line through a recent period of data. Setup parameters for the indicator include the degree of the polynomial (1 - 6) and number of bars to analyze. Bands are drawn above and below the regression line between two user-specified multiples of standard deviation. The bands self adjust for volatility.
Keyboard Adjustment
Select the PRC by clicking on the central regression line, then use the left and right arrow keys to adjust the period. Each tap on the left arrow key increase the period by 1 (moves the start of line back one bar) and each tap on the right arrow key increases the period by 1 (moves the start of the line forward one bar). Use the mouse wheel when selected to move the upper and lower bands closer and further from the central regression line.
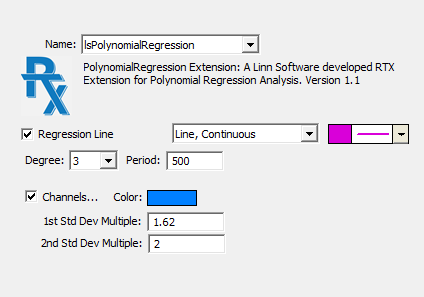
- Regression Line - Check this box to draw the Polynomial Regression line. When checked, a drawing style and color option is presented.
- Degree - Degree of the Polynomial Regression Line. User may choose between 1st, 2nd, 3rd, 4th, 5th, and 6th degree.
- Period - The period specified dictates the number of most recent bars which are used in the computation of the polynomial regression. As new bars forms, the polynomial regression will dynamically adjust to the most recent period of bars.
- Channels - Check this box to turn the channels on. When turned on, the user may specify both the color of the channels/bands, as well as the two standard deviation multiples. Bands will be drawn between those two multiples on both sides of the polynomial regression line.
 |
Polynomial Regression Channel (PRC) is an RTX Extension indicator that draws a best fit n-degree polynomial regression line through a recent period of data. Setup parameters for the indicator include... Read more Download
|
|
|
RTL is the Investor/RT Language, a formula language for composing trading signals, custom indicators, and scans. RTL is an end user language, designed to be used by those with little or no programming skills. RTL is used to write a formula. A formula may be a true/false condition, e.g. CLOSE < MA, that determines whether some condition is true or not for each bar (a signal) or the last bar (a scan). A formula may compute an arithmetic result, called a custom indicator. For example: MA ( HIGH - CLOSE ) computes a moving average of how far an instrument closes from its high. As you can see, RTL is more expressive, simpler, and easier to use than other market data languagues. Read more
|


