How do I Compute the IB (Initial Balance) High, Low, or Range?
Also see: RTL Tutorial
Compute the IB (Initial Balance) High, Low, or Range?
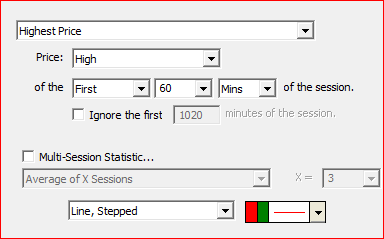
This would be done with the Session Statistics Indicator (SESST). To compute the IB High, setup SESST with "Highest Price: High: First 60 Mins of the session." as seen below:

To access the IB Low, use "Lowest Price: Low of the First 60 Mins of session". This will only work if you're charting (or backtesting) a session that starts with the IB, such as session 2 (9:30am to 4:15pm ET). If you're using session 31, check the "Ignore the first 1020 minutes of the session" checkbox.
To get the range of the IB, setup SESST as "High/Low Range of the First 60 Mins of the session".
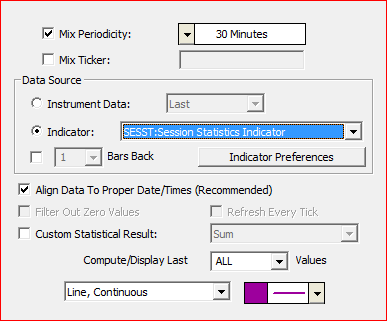
NOTE: This method works accurately for all time-based intraday periodicities (Minute bars and Second bars). However, since it operates on the actual bars in the chart, it may not work accurately for periodicities such as Range bars, Volume bars, Tick bars, etc...periodicities which result in bars which span the IB boundaries (started within IB and finished after IB). It is however possible to access these IB values for these periodicities by using the Mixed Periodicity Indicator setup as you see below:

For multi-chart highlighting, also see: Multi-pane Charts Quick Start Guide

